Tutorial 2: Running a sample with a single-end FASTQ
In this first example, basic instructions to run a single-end FASTQ file using the entire SEISMIC-RNA workflow are provided.
Download example file
A single-end FASTQ file was generated using seismic sim. The file, with
its corresponding reference fasta file, can be downloaded here:
If you have wget, you can download the tutorial data simply by typing
wget https://raw.githubusercontent.com/rouskinlab/seismic-rna/main/src/userdocs/tutorials/single-end/data.tar
Otherwise, click this link to download the tutorial data: https://raw.githubusercontent.com/rouskinlab/seismic-rna/main/src/userdocs/tutorials/single-end/data.tar
To ensure the download is complete and not corrupted, verify that the SHA-256
checksum is d89407e958e018eadecb72665c7aa6e0f0344ec55a813368dc4ce07995c5729e
by typing this command:
shasum -a 256 data.tar
If this command prints a different checksum, then retry the download. If the problem persists, then raise an issue (see Bugs and Requests).
After downloading and verifying the data, untar the data by typing
tar xvf data.tar
and then navigate into the data directory:
cd data
Run the SEISMIC-RNA workflow
To run the entire workflow (seismic wf) on a single-end FASTQ file, you
only need to provide SEISMIC-RNA with a reference fasta file, the FASTQ file,
and the option -z:
seismic wf sim_single_end.fa -z sim_single_end_ref.fq.gz --fold --draw --export
The other flags are included to fold the sequence using the calculated mutation
rates as constraints (--fold), generate a model of the folded sequence
(--draw), and export the results in .json format for loading into SEISMICgraph (--export).
Output
SEISMIC-RNA will automatically create the index, align, idmut, filter, and produce a number of graphs (see How SEISMIC-RNA Works). By default, the graphs that are provided are:
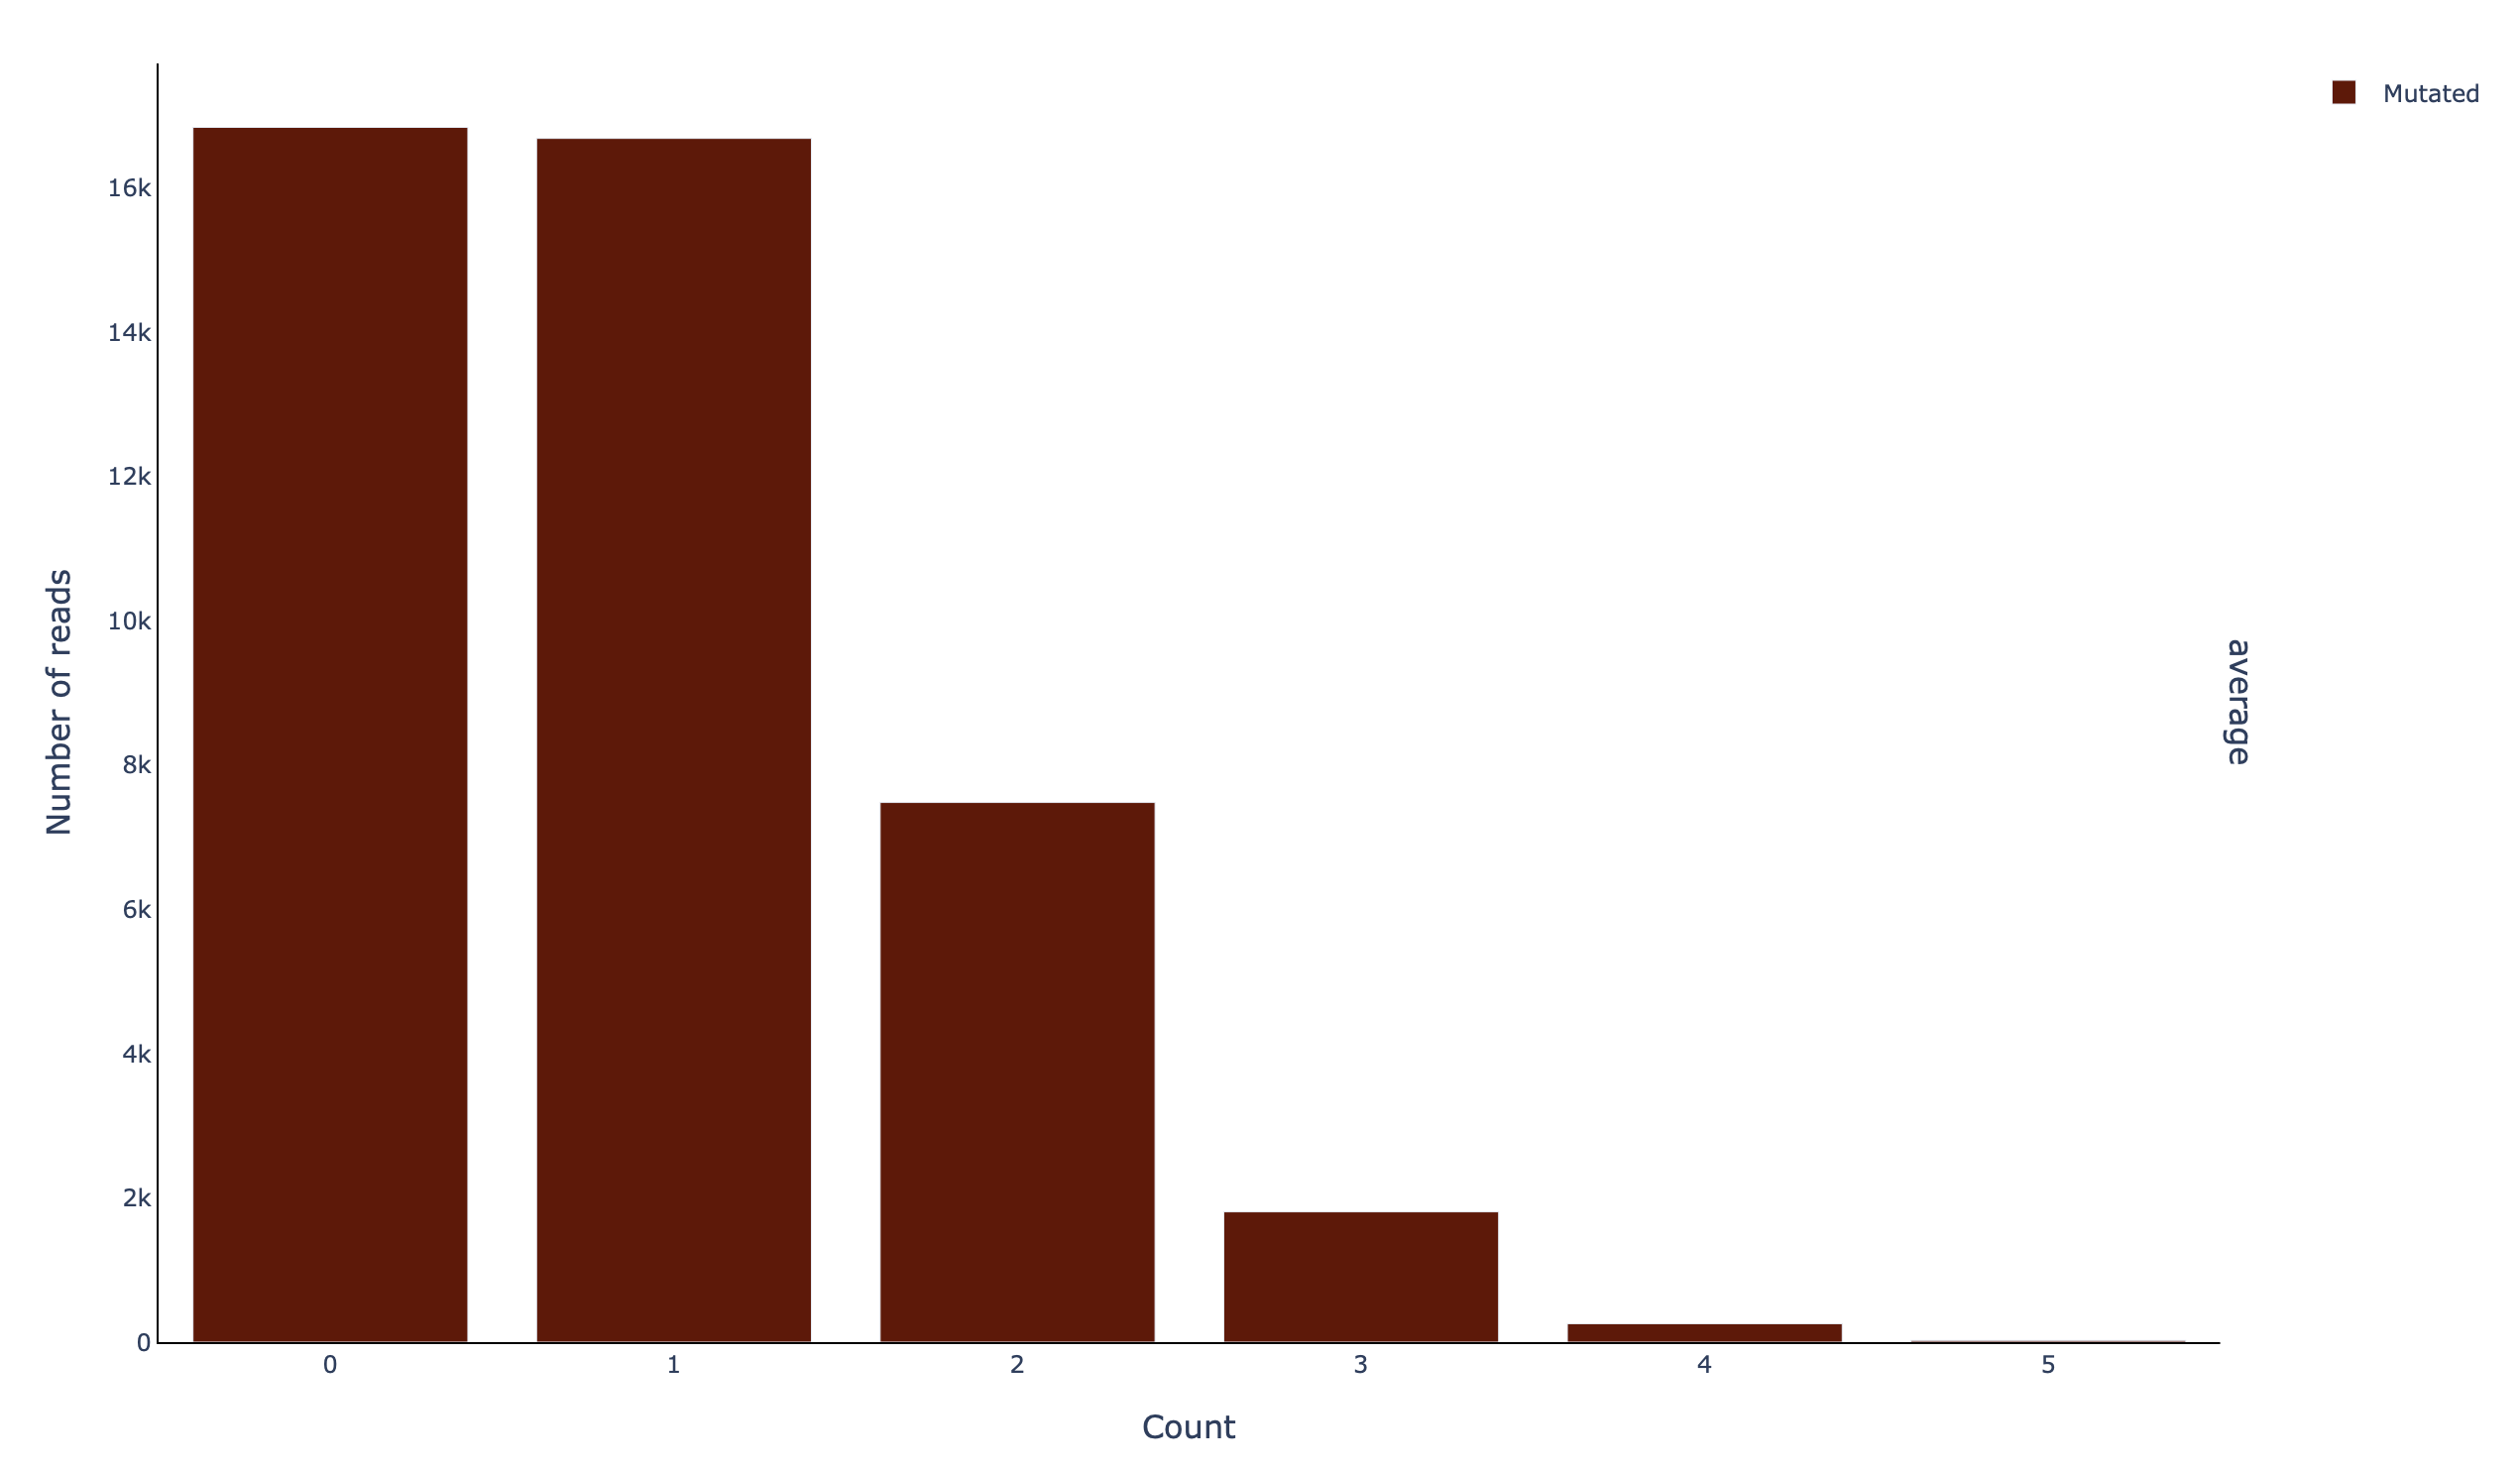
A histogram of the mutations per read (histread_filtered_m-count):
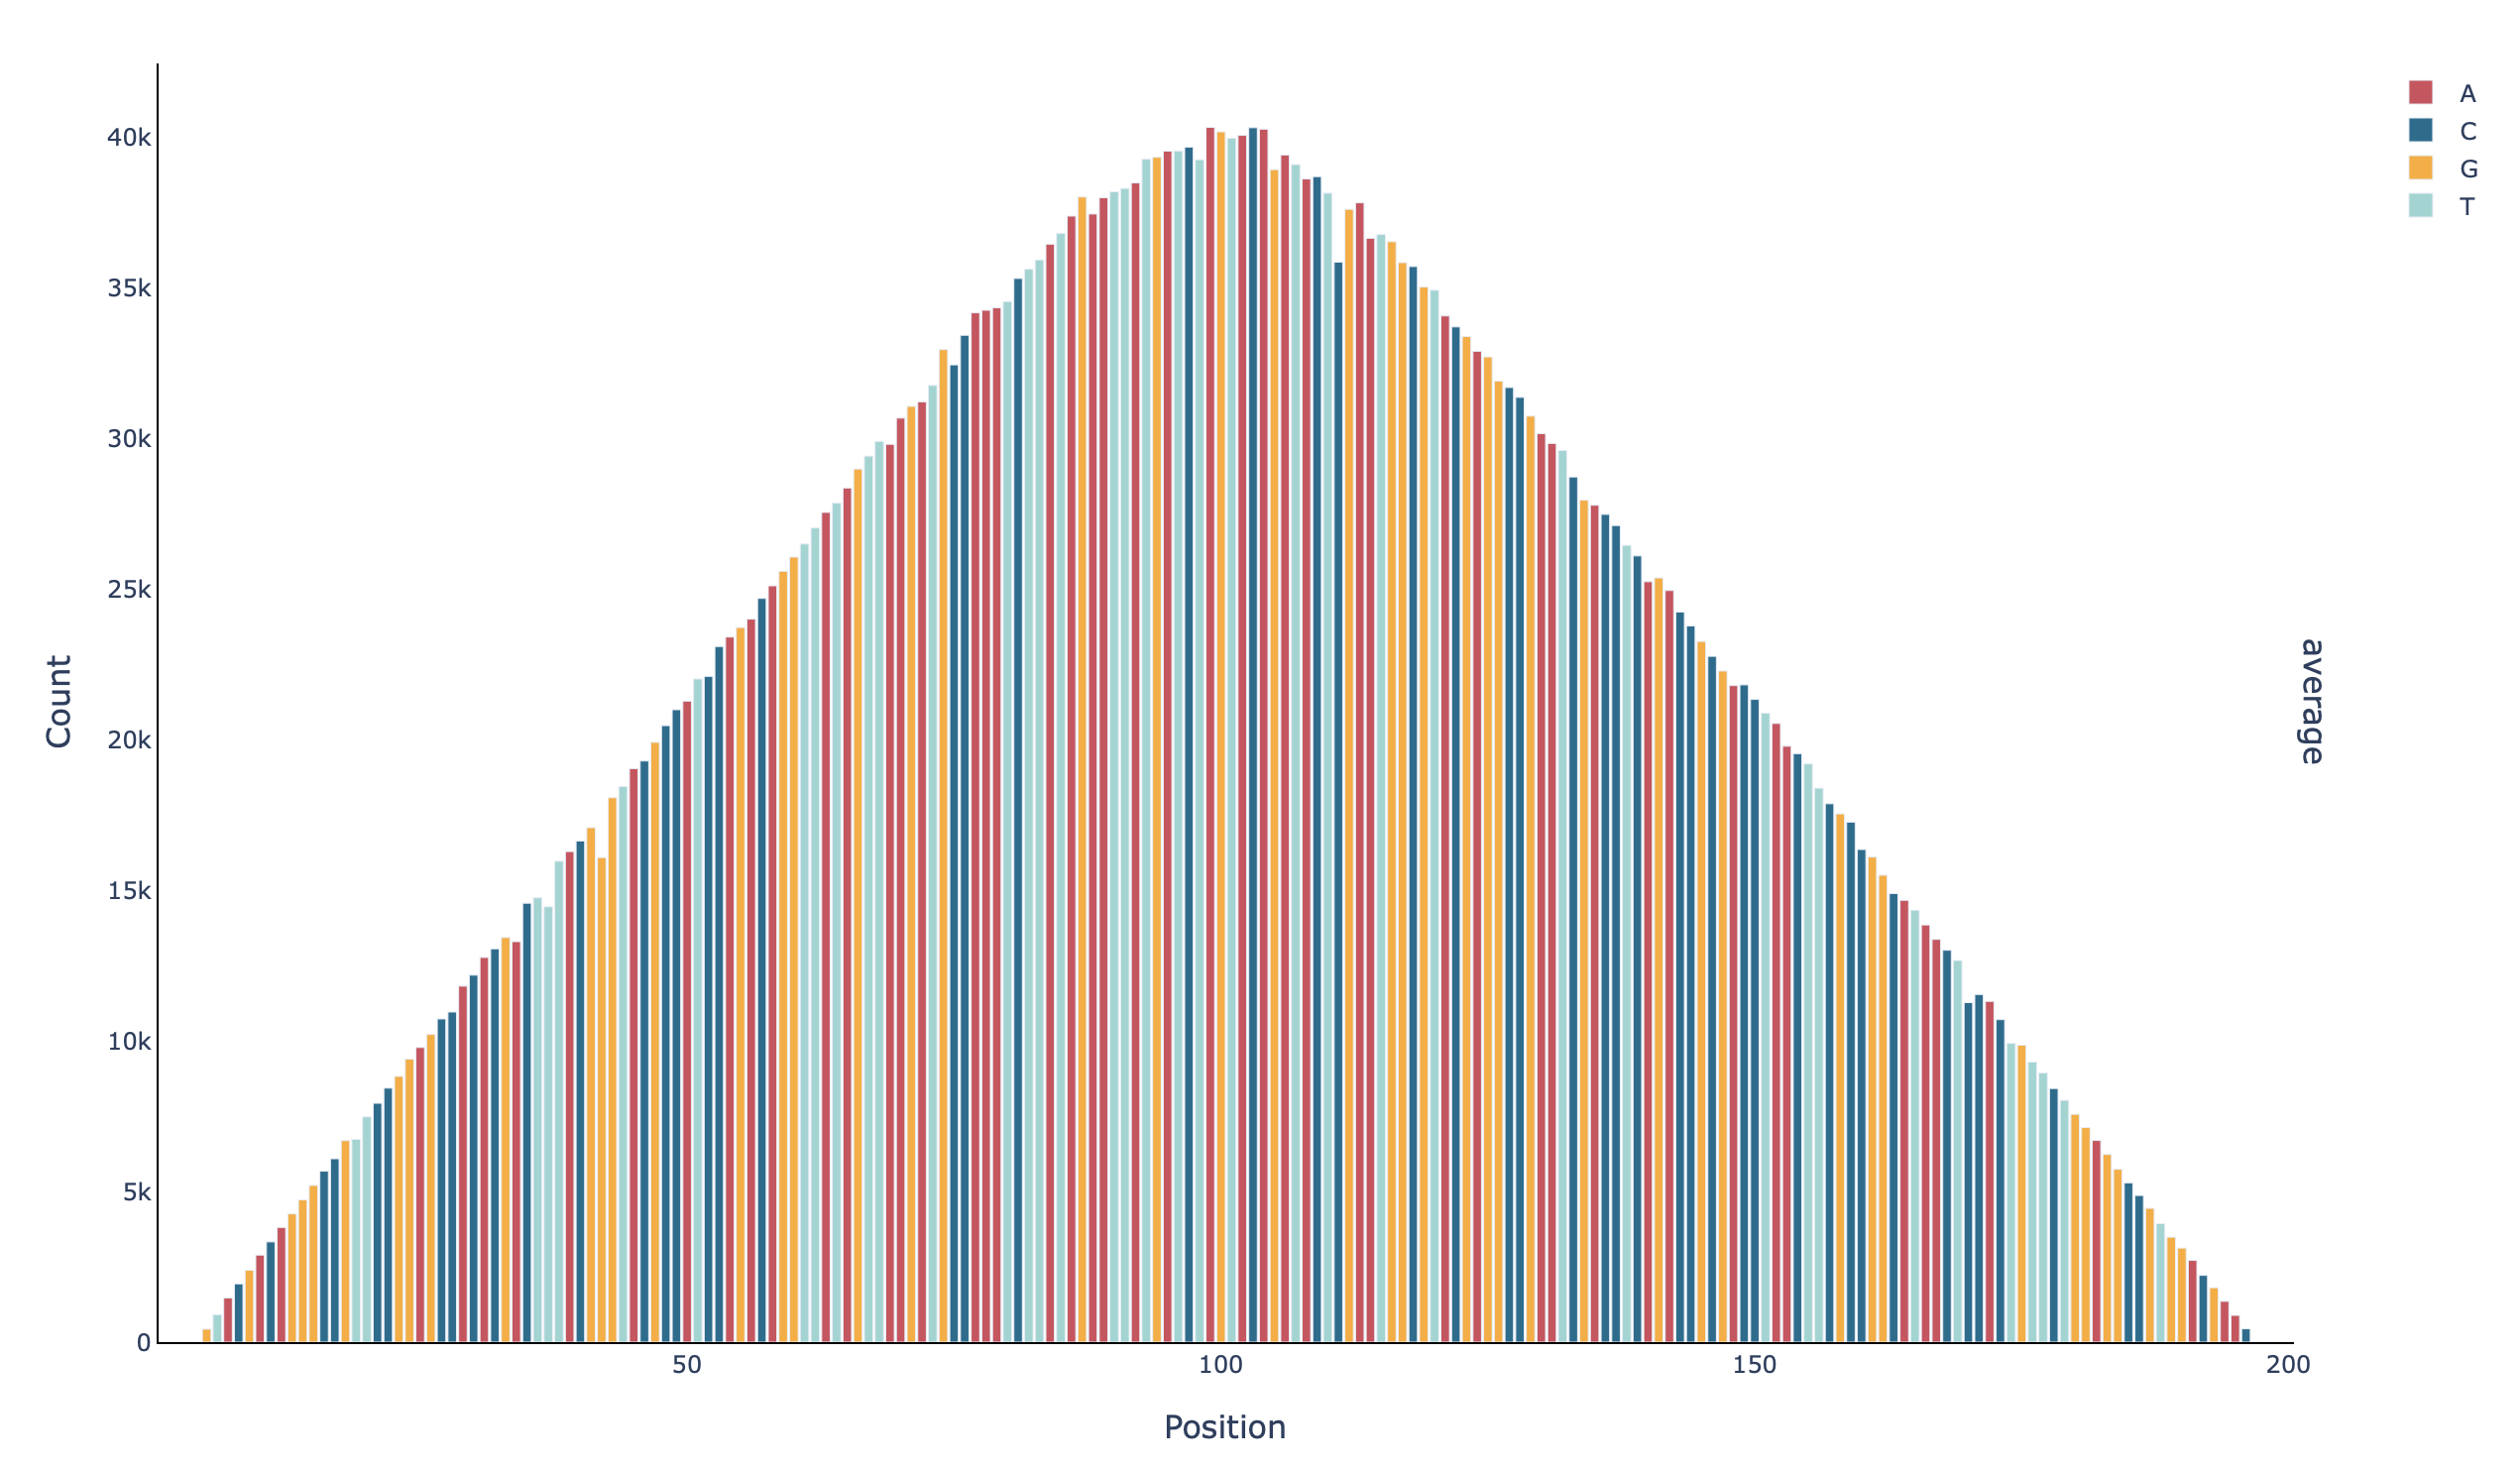
A barplot with the coverage per base in all positions (profile_unfiltered_n-count):
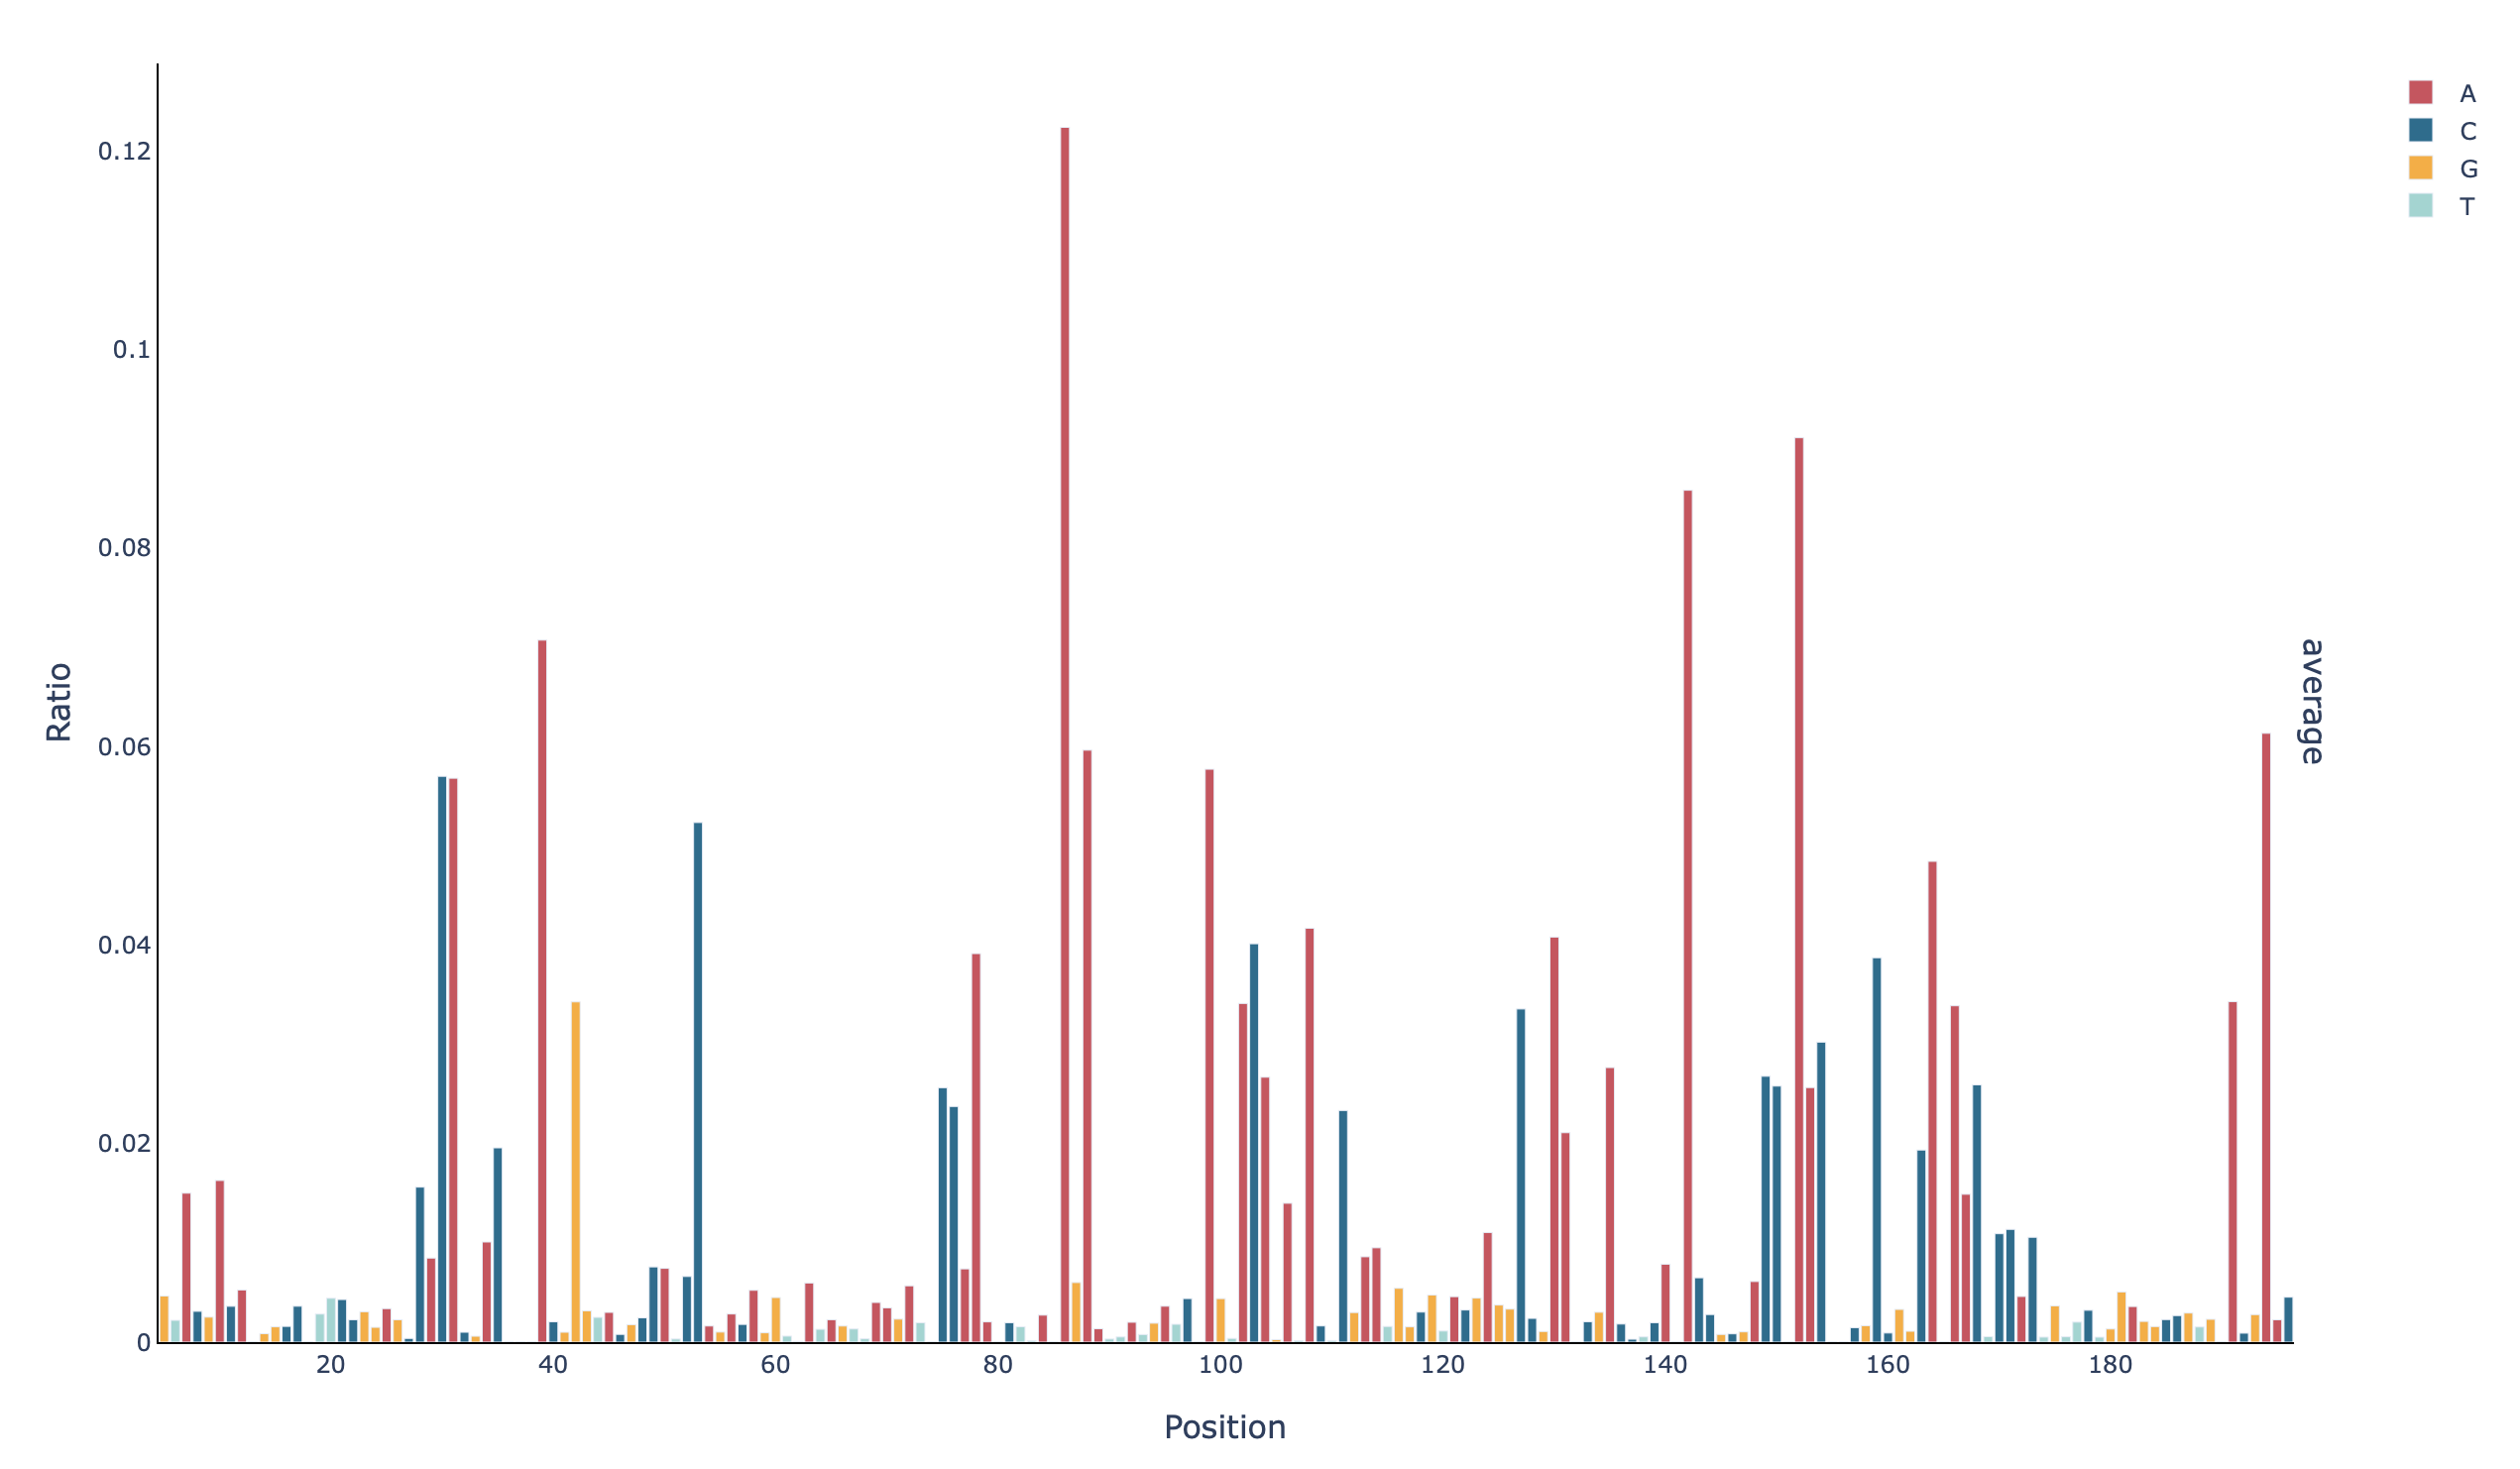
A barplot with the mutation rate per base in all positions (profile_unfiltered_m-ratio):
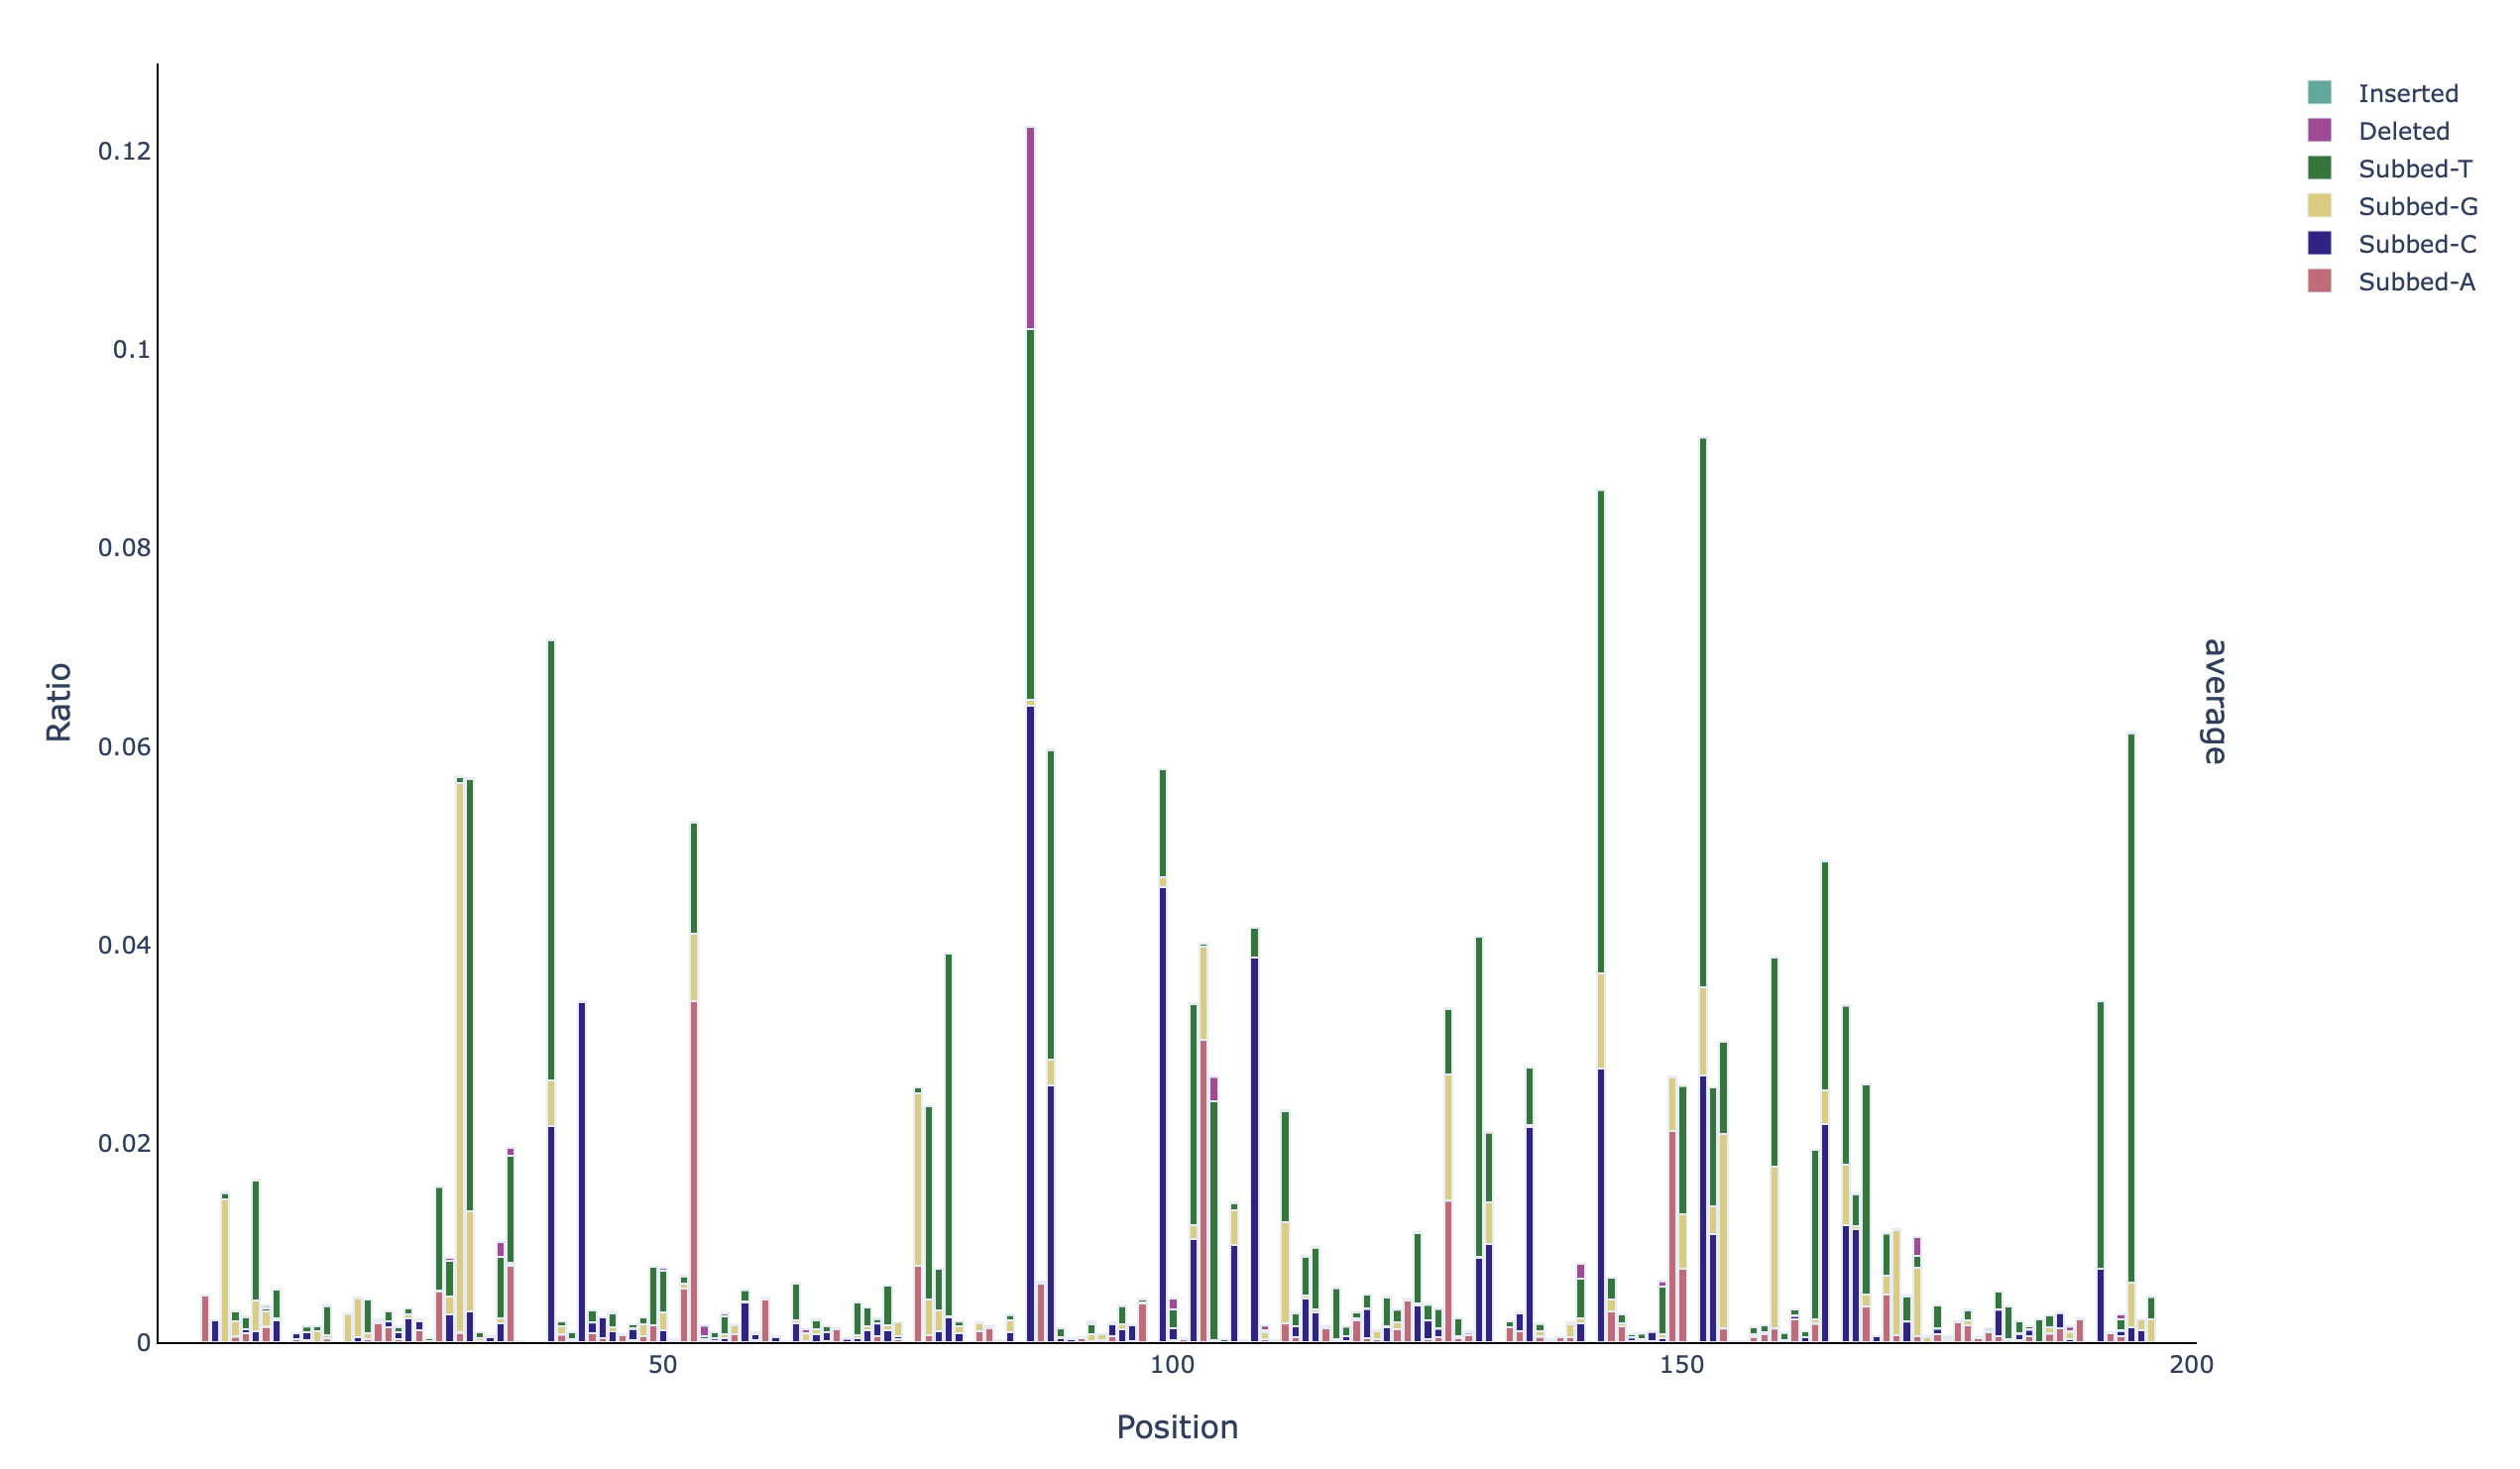
A stacked barplot with the identity of the mutations per base in all positions (profile_unfiltered_acgtdi-ratio):
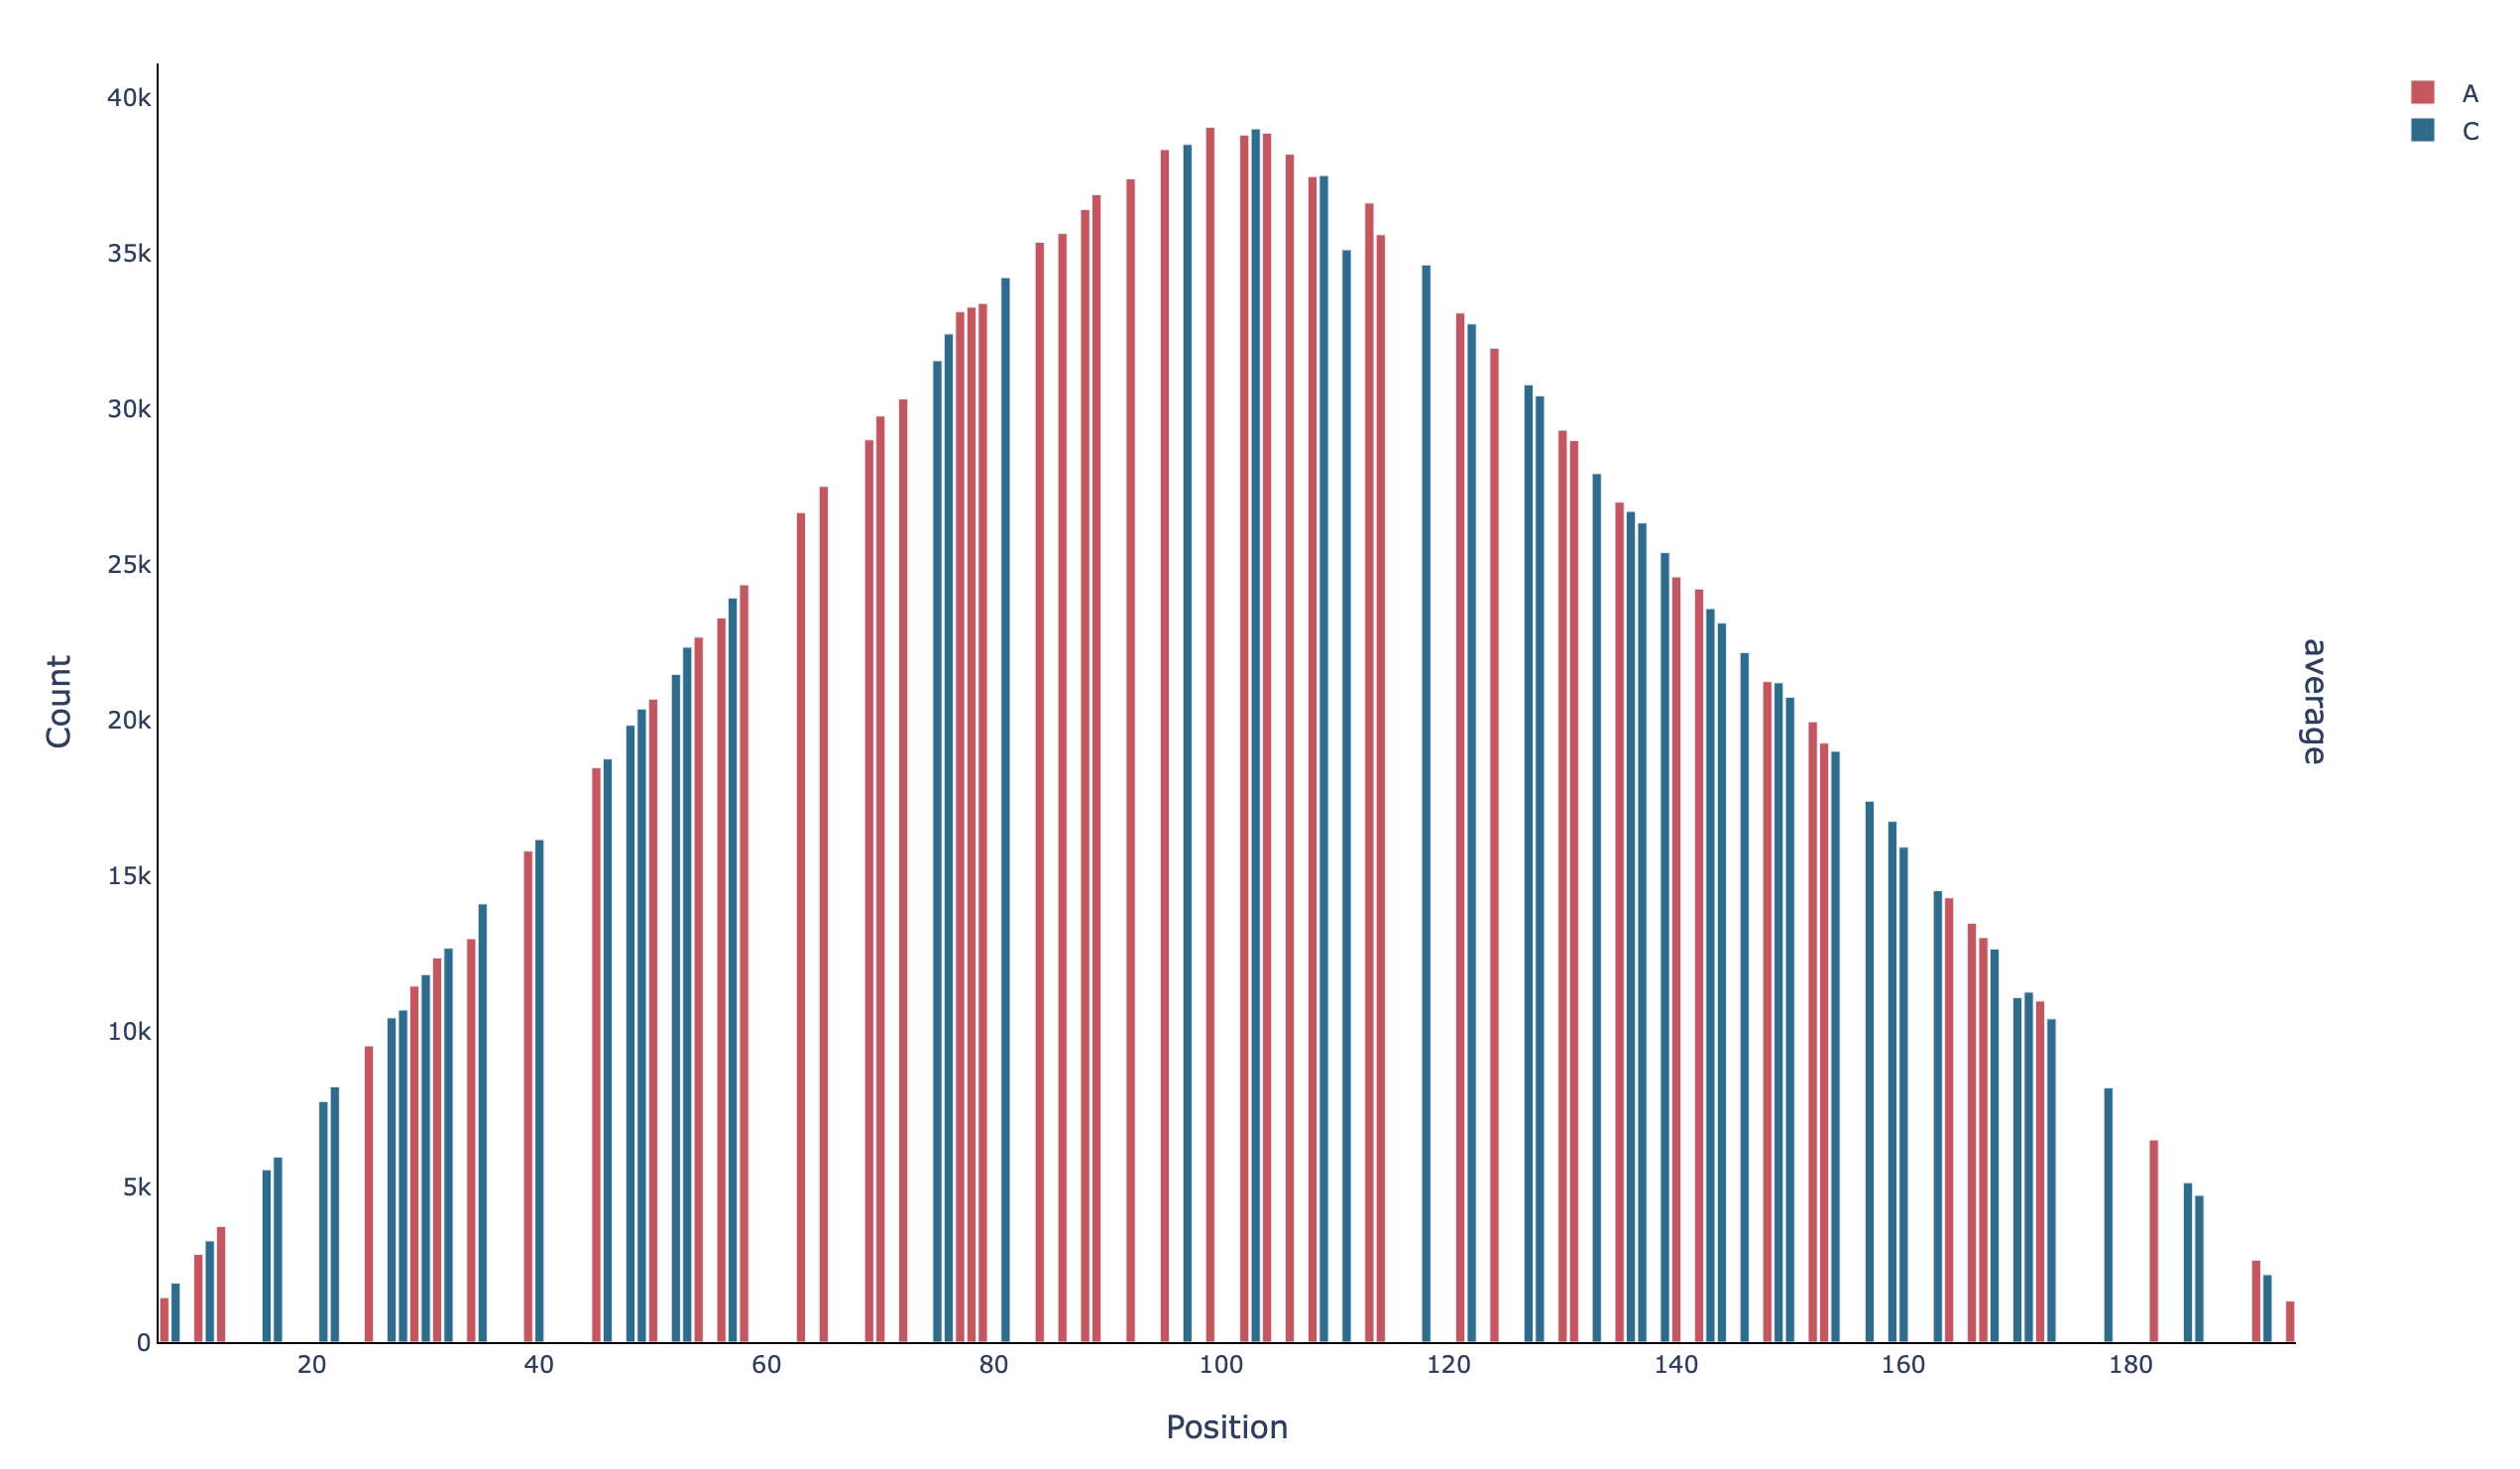
A barplot with the coverage per base in the unmasked positions (profile_filtered_n-count):
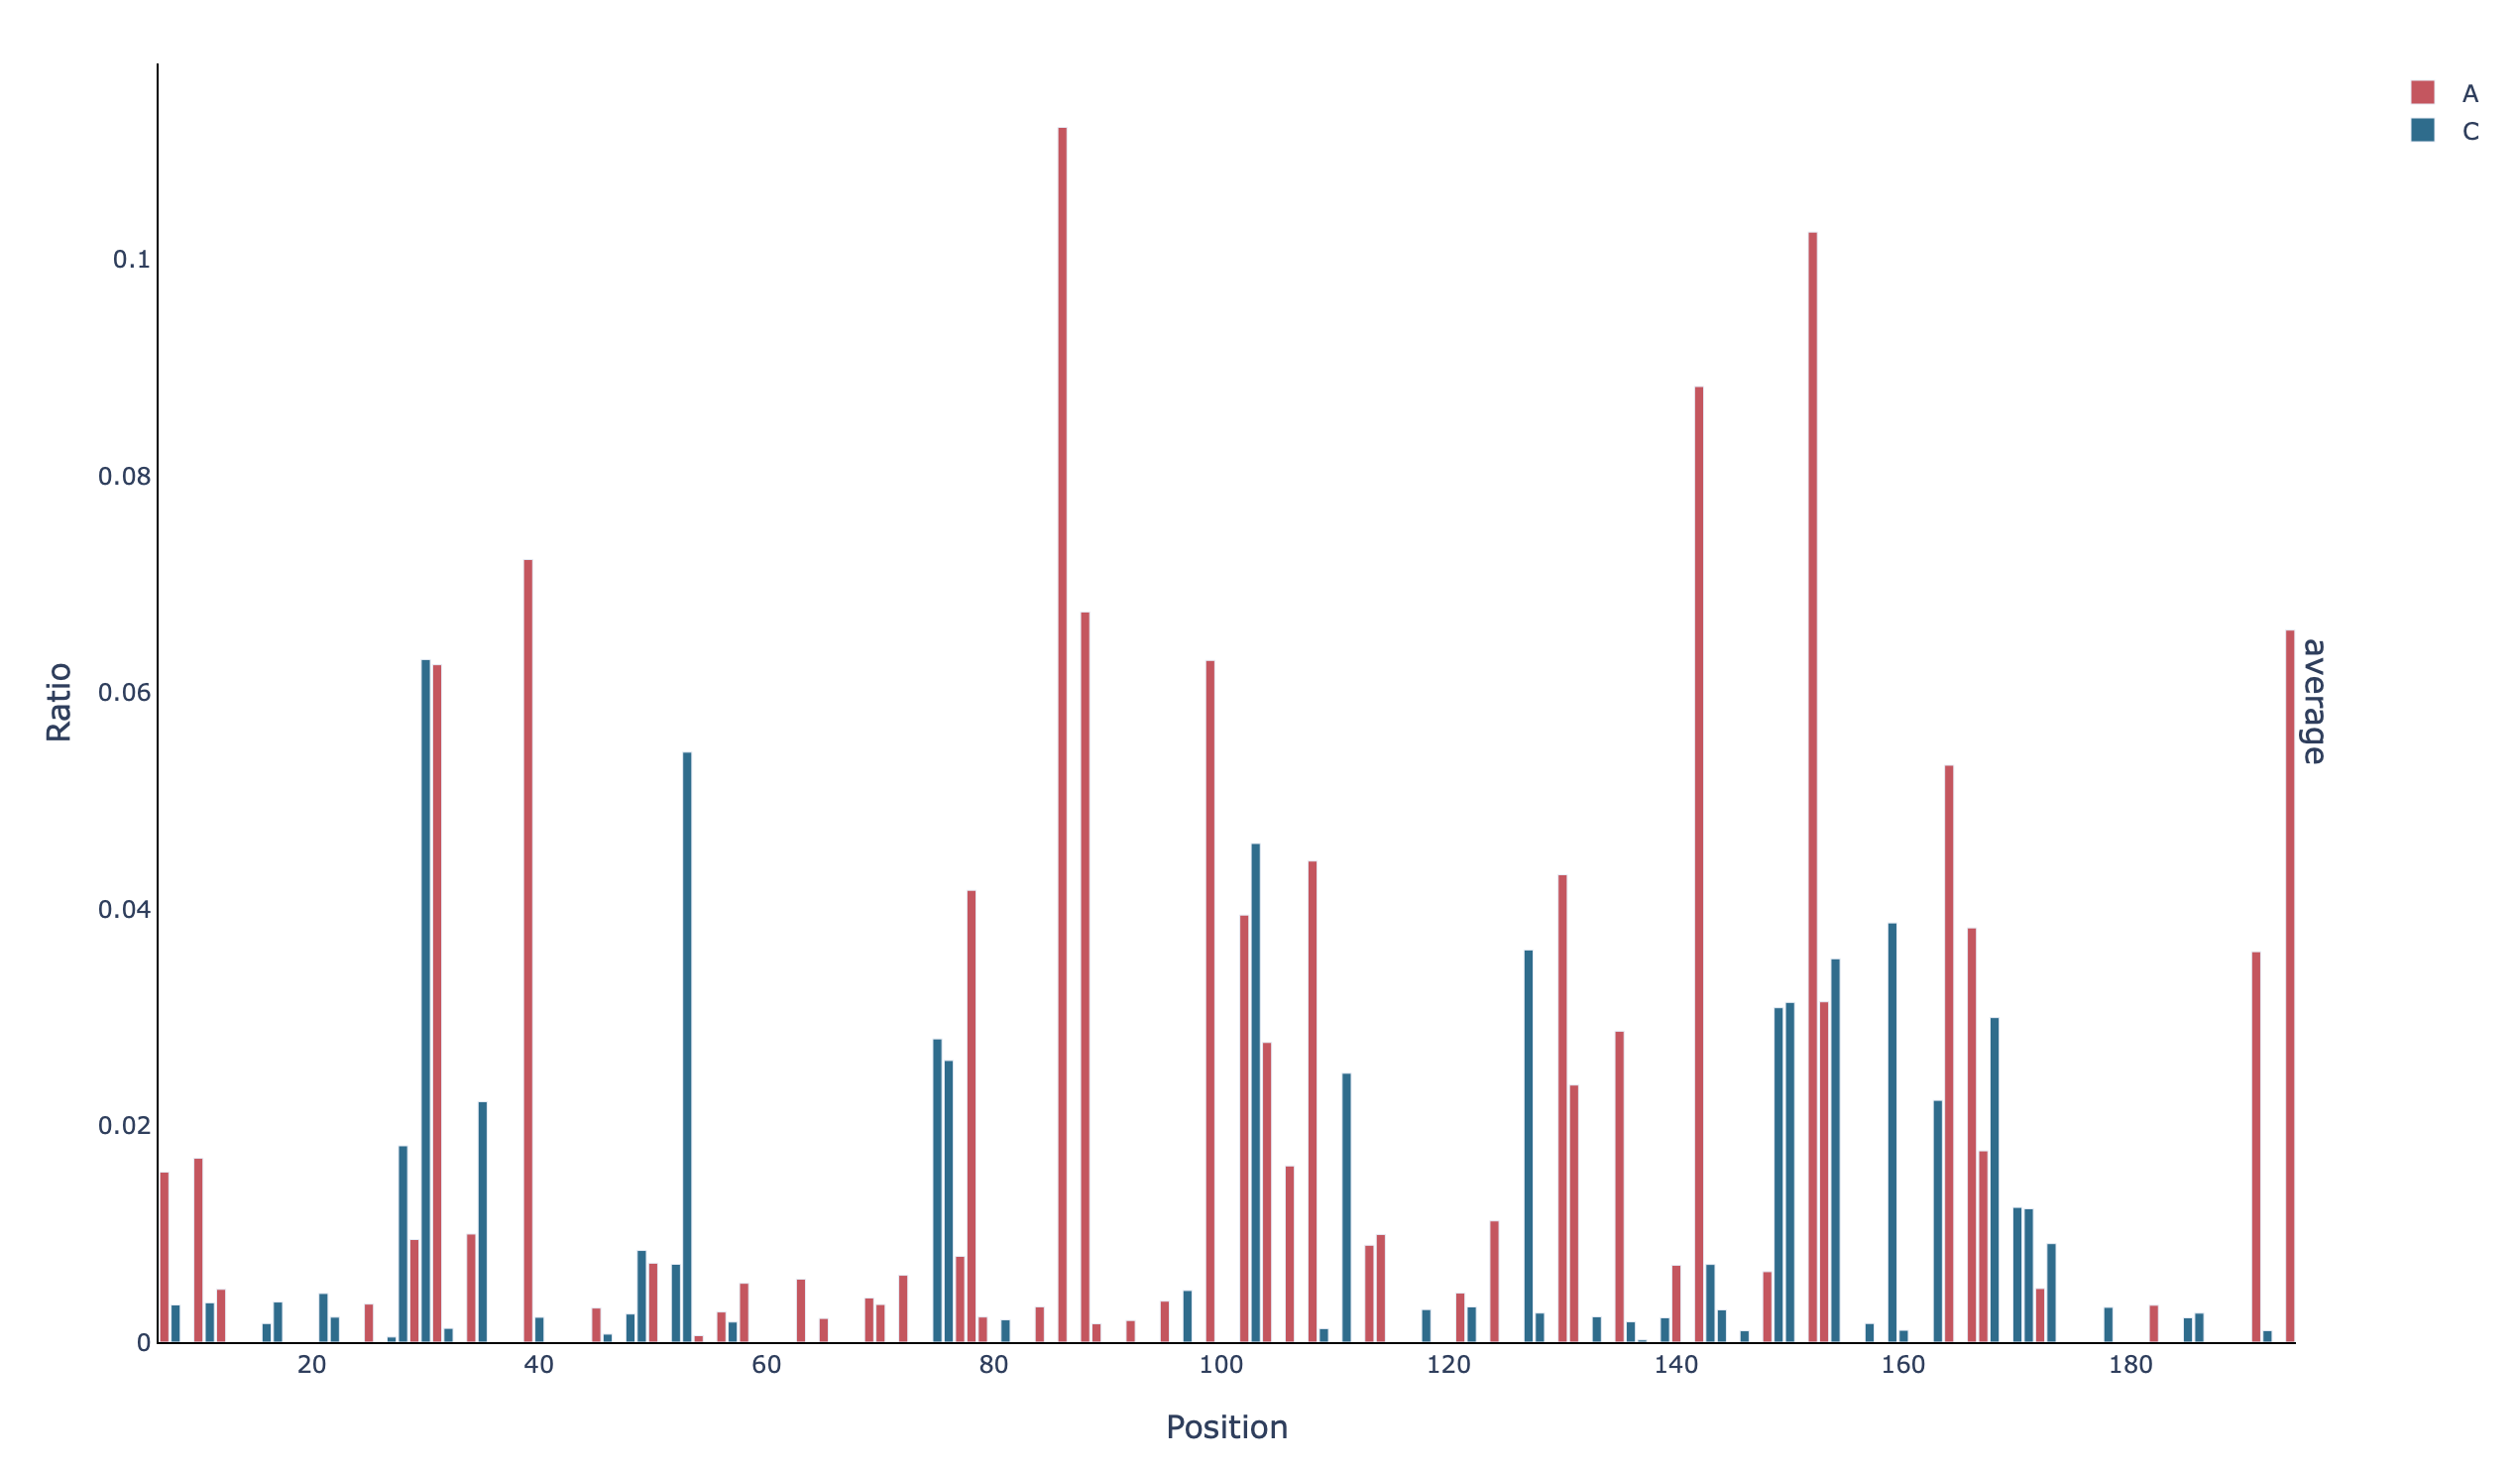
A barplot with the mutation rate per base in the unmasked positions (profile_filtered_m-ratio):
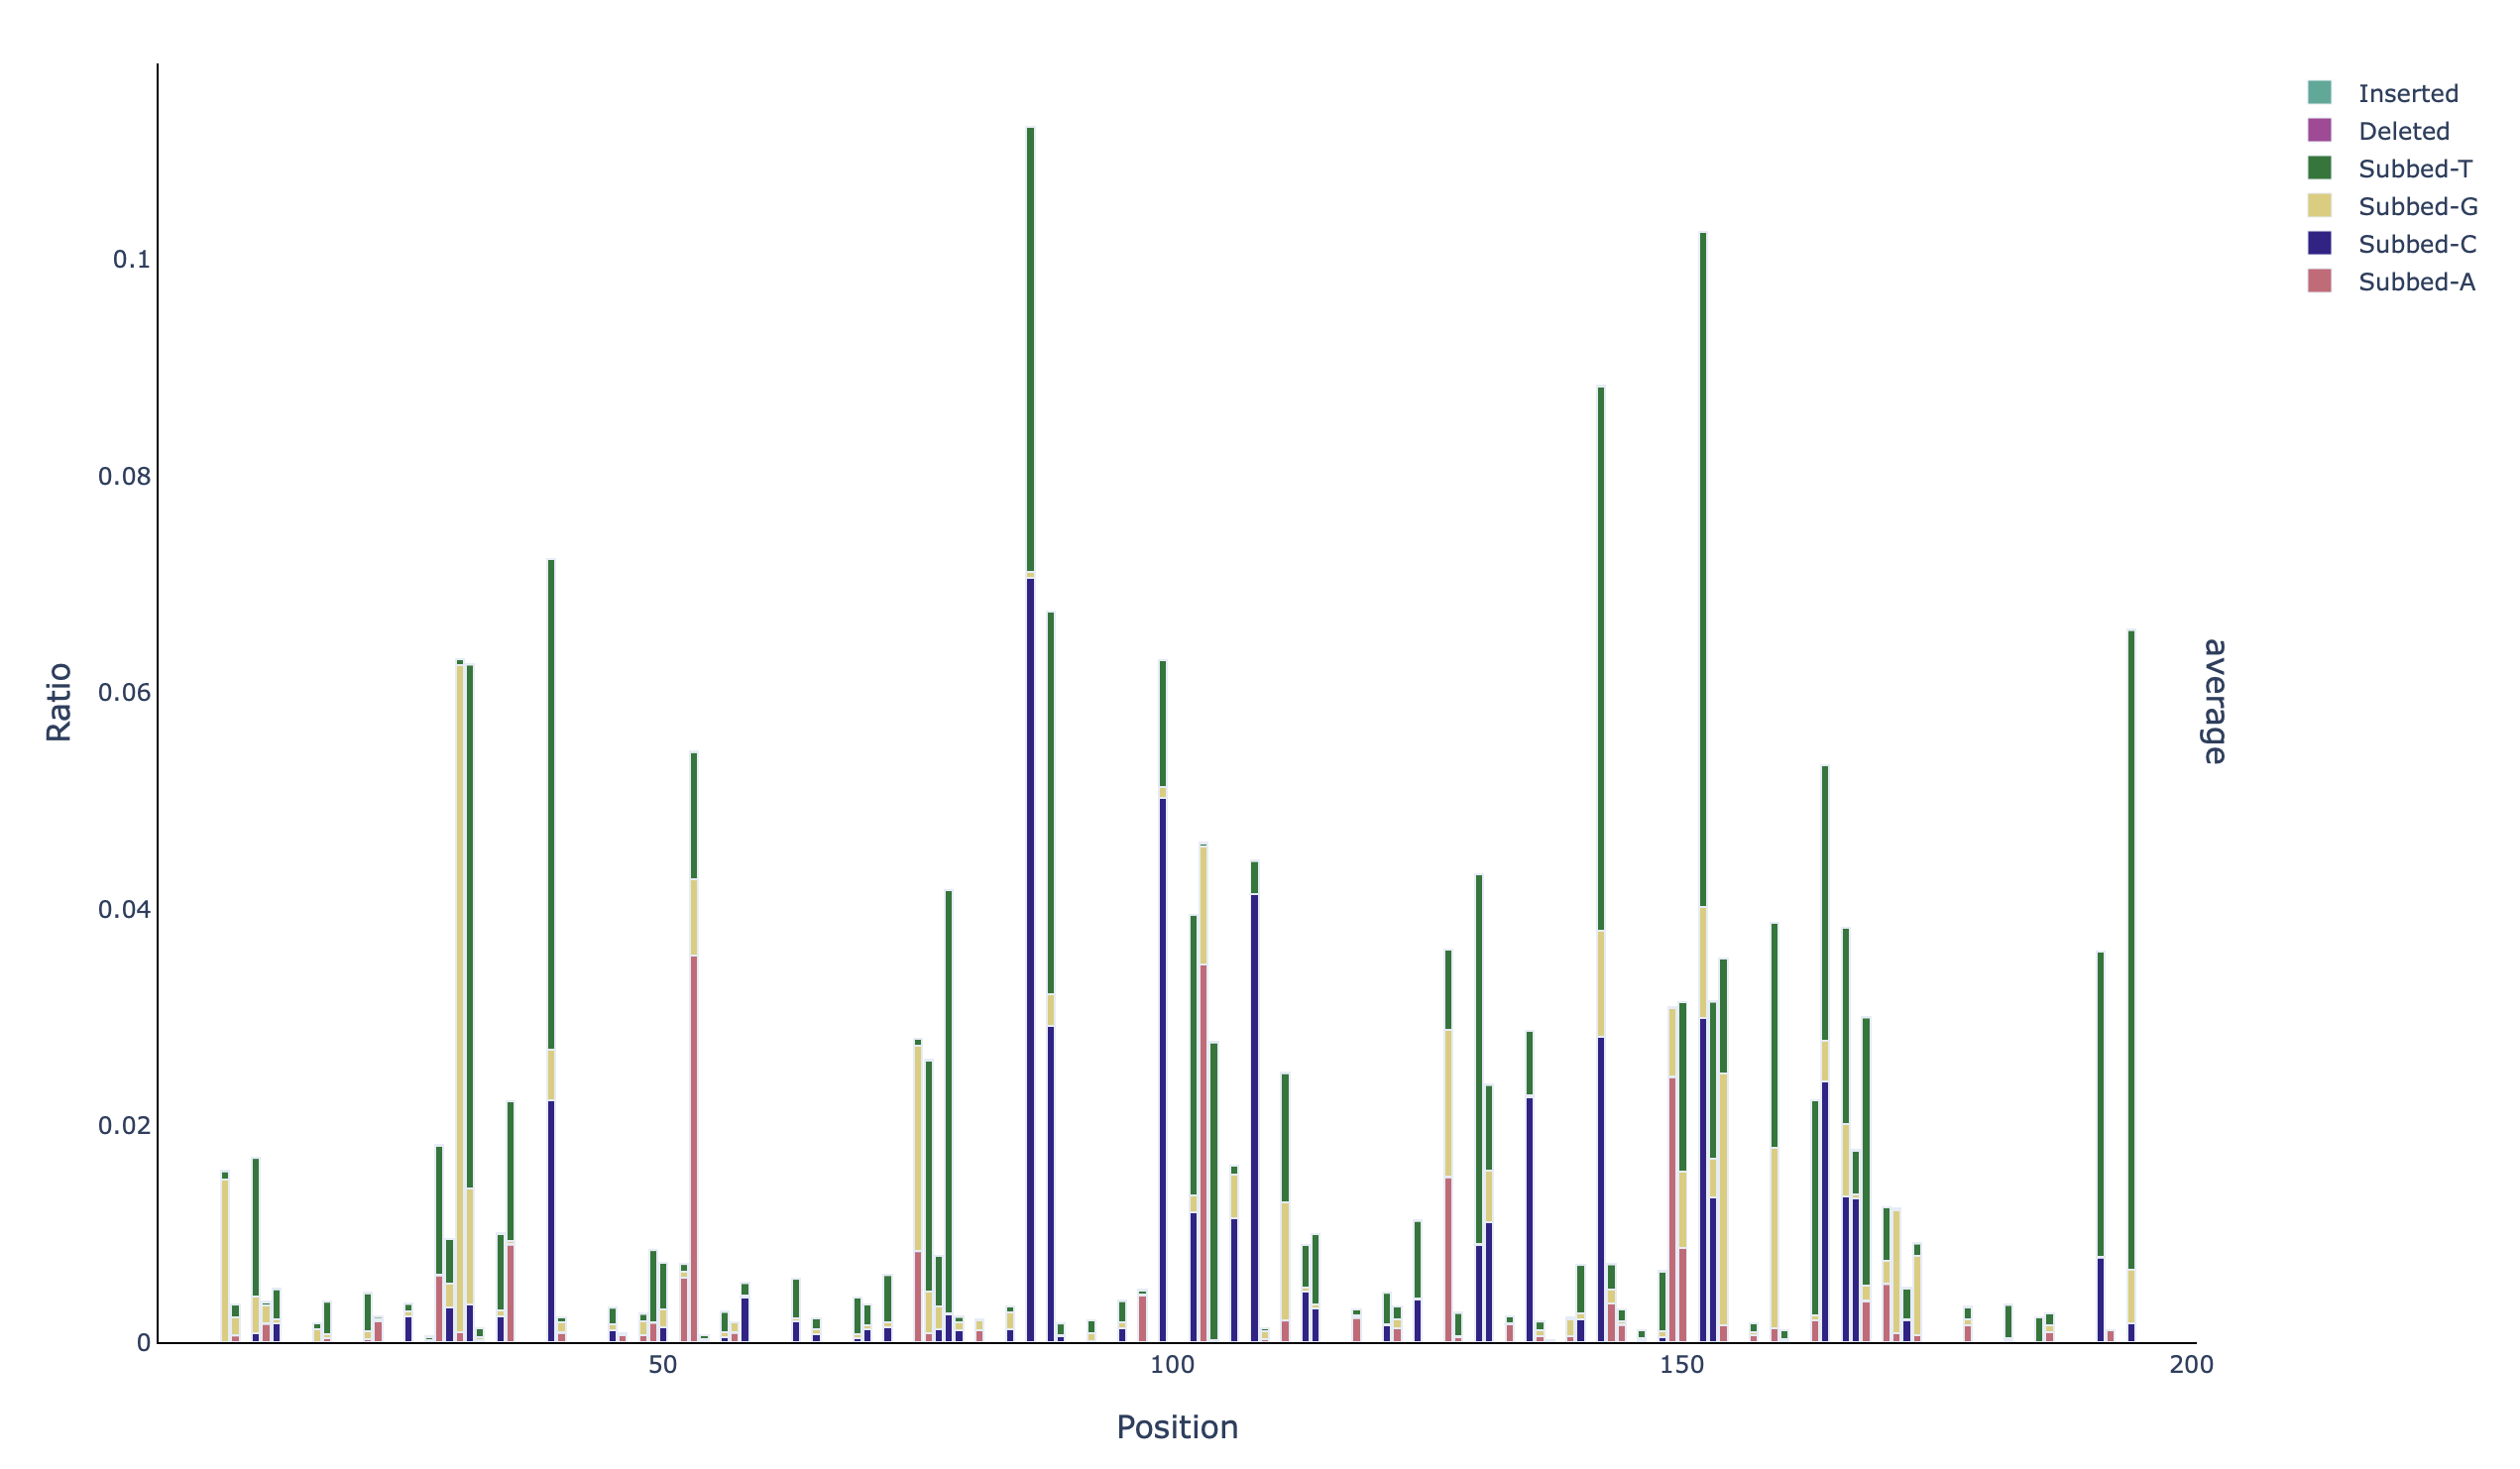
A stacked barplot with the identity of the mutations per base in the unmasked positions (profile_filtered_acgtdi-ratio):
Additionally, because the
--foldflag was included, an ROC curve plot is outputted describing the accuracy of the models provided by fold: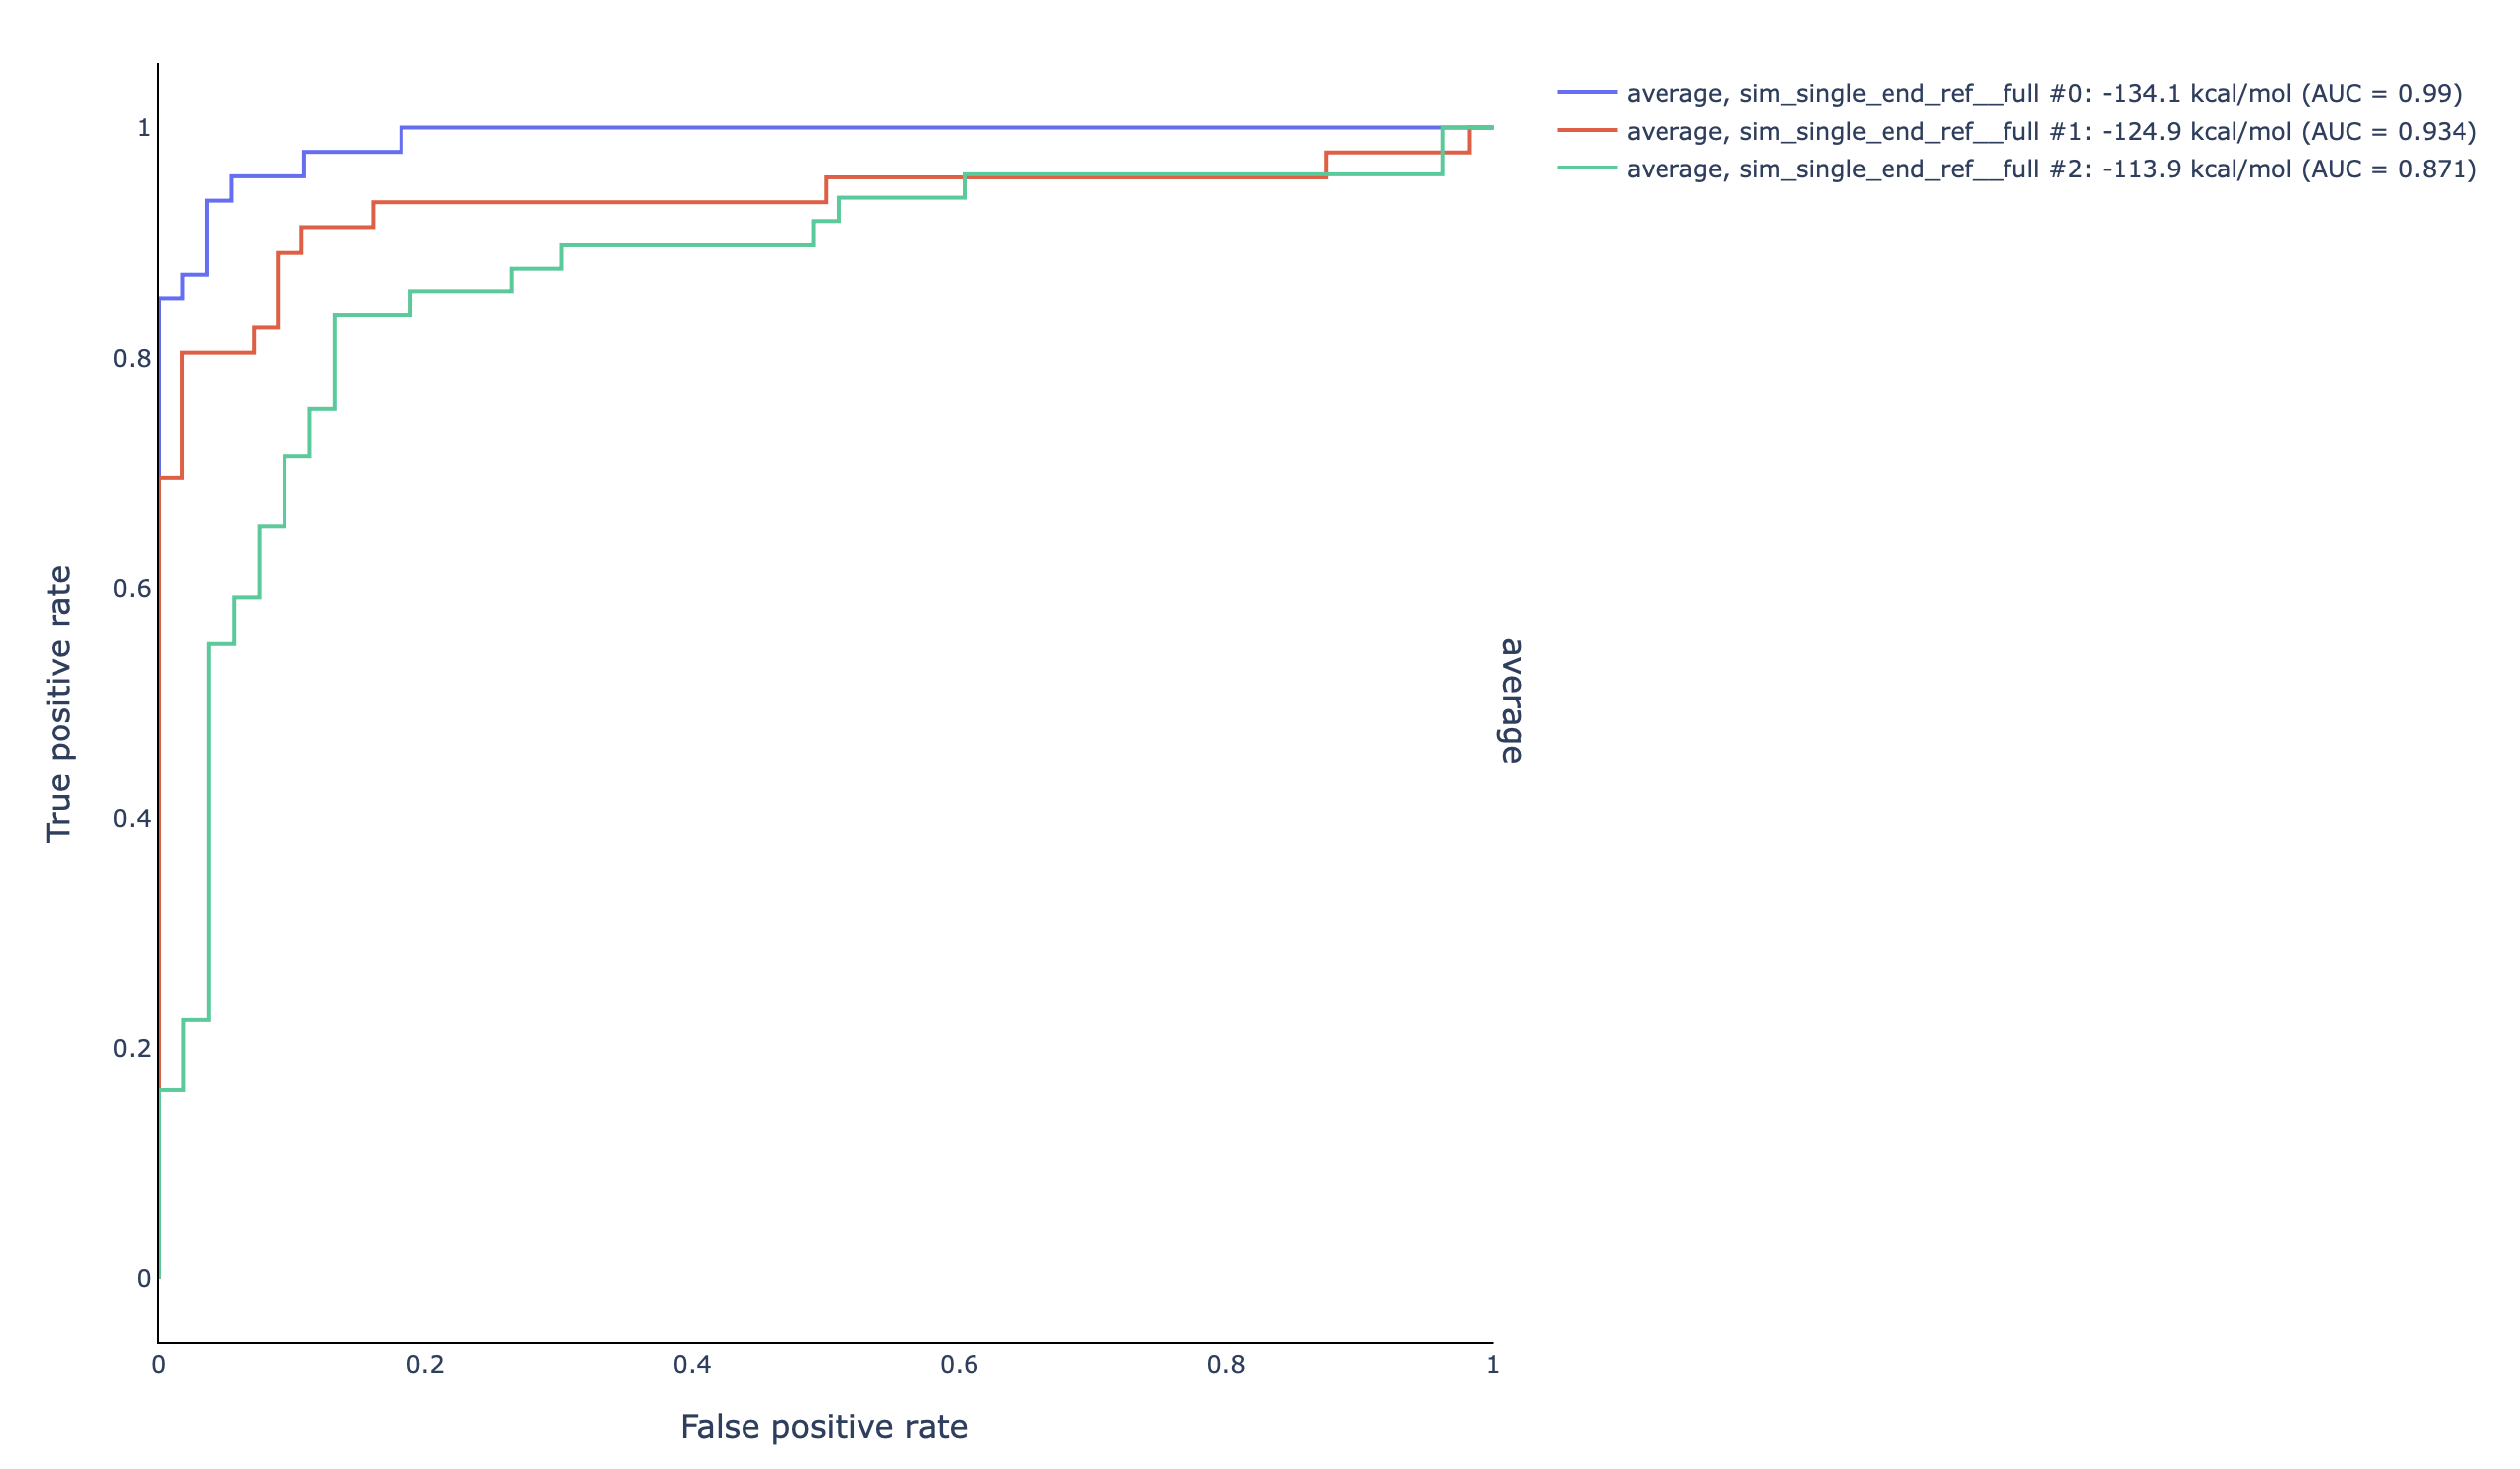
Furthermore, SEISMIC-RNA provides tables and reports
(see Report Formats) for each of the steps described above.
Since the flag --export was also chosen, a .json file is
created that can be loaded into SEISMICgraph to expand the plotting options.
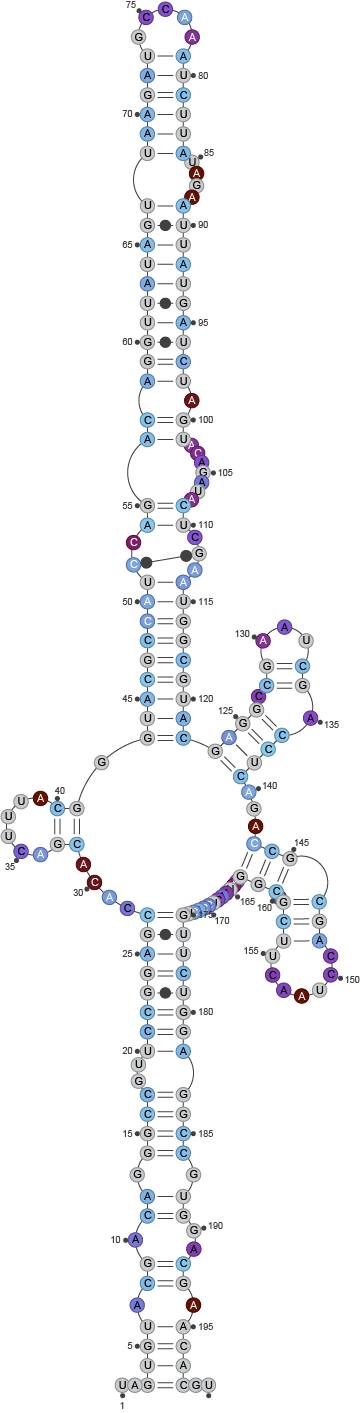
Finally, by using --draw, a model was produced too, that can
be found in the fold directory of the output: