Tutorial 3: Clustering
In this second example, basic instructions to do clustering on paired-end FASTQs are provided.
Download example file
Paired-end FASTQ files were generated using seismic sim. The files, with
their corresponding reference fasta file, can be downloaded here:
If you have wget, you can download the tutorial data simply by typing
wget https://raw.githubusercontent.com/rouskinlab/seismic-rna/main/src/userdocs/tutorials/clustering/data.tar
Otherwise, click this link to download the tutorial data: https://raw.githubusercontent.com/rouskinlab/seismic-rna/main/src/userdocs/tutorials/clustering/data.tar
To ensure the download is complete and not corrupted, verify that the SHA-256
checksum is f4216f9234d1bb344f1c75d34433758aff734138d6c3fc124d50a63be5d8023d
by typing this command:
shasum -a 256 data.tar
If this command prints a different checksum, then retry the download. If the problem persists, then raise an issue (see Bugs and Requests).
After downloading and verifying the data, untar the data by typing
tar xvf data.tar
and then navigate into the data directory:
cd data
Run the SEISMIC-RNA workflow
For this example, the entire workflow (seismic wf) will be run adding a
flag for clustering (--cluster), and -x for paired-end FASTQs. There
is no need to provide the FASTQ files one by one, SEISMIC-RNA will find them
with only giving it the directory:
seismic wf fq/sim_clustering.fa -x fq/ --cluster
Output
Aside from the default outputs already described in Tutorial 2: Running a sample with a single-end FASTQ, clustering will provide additional tables, reports, and plots:
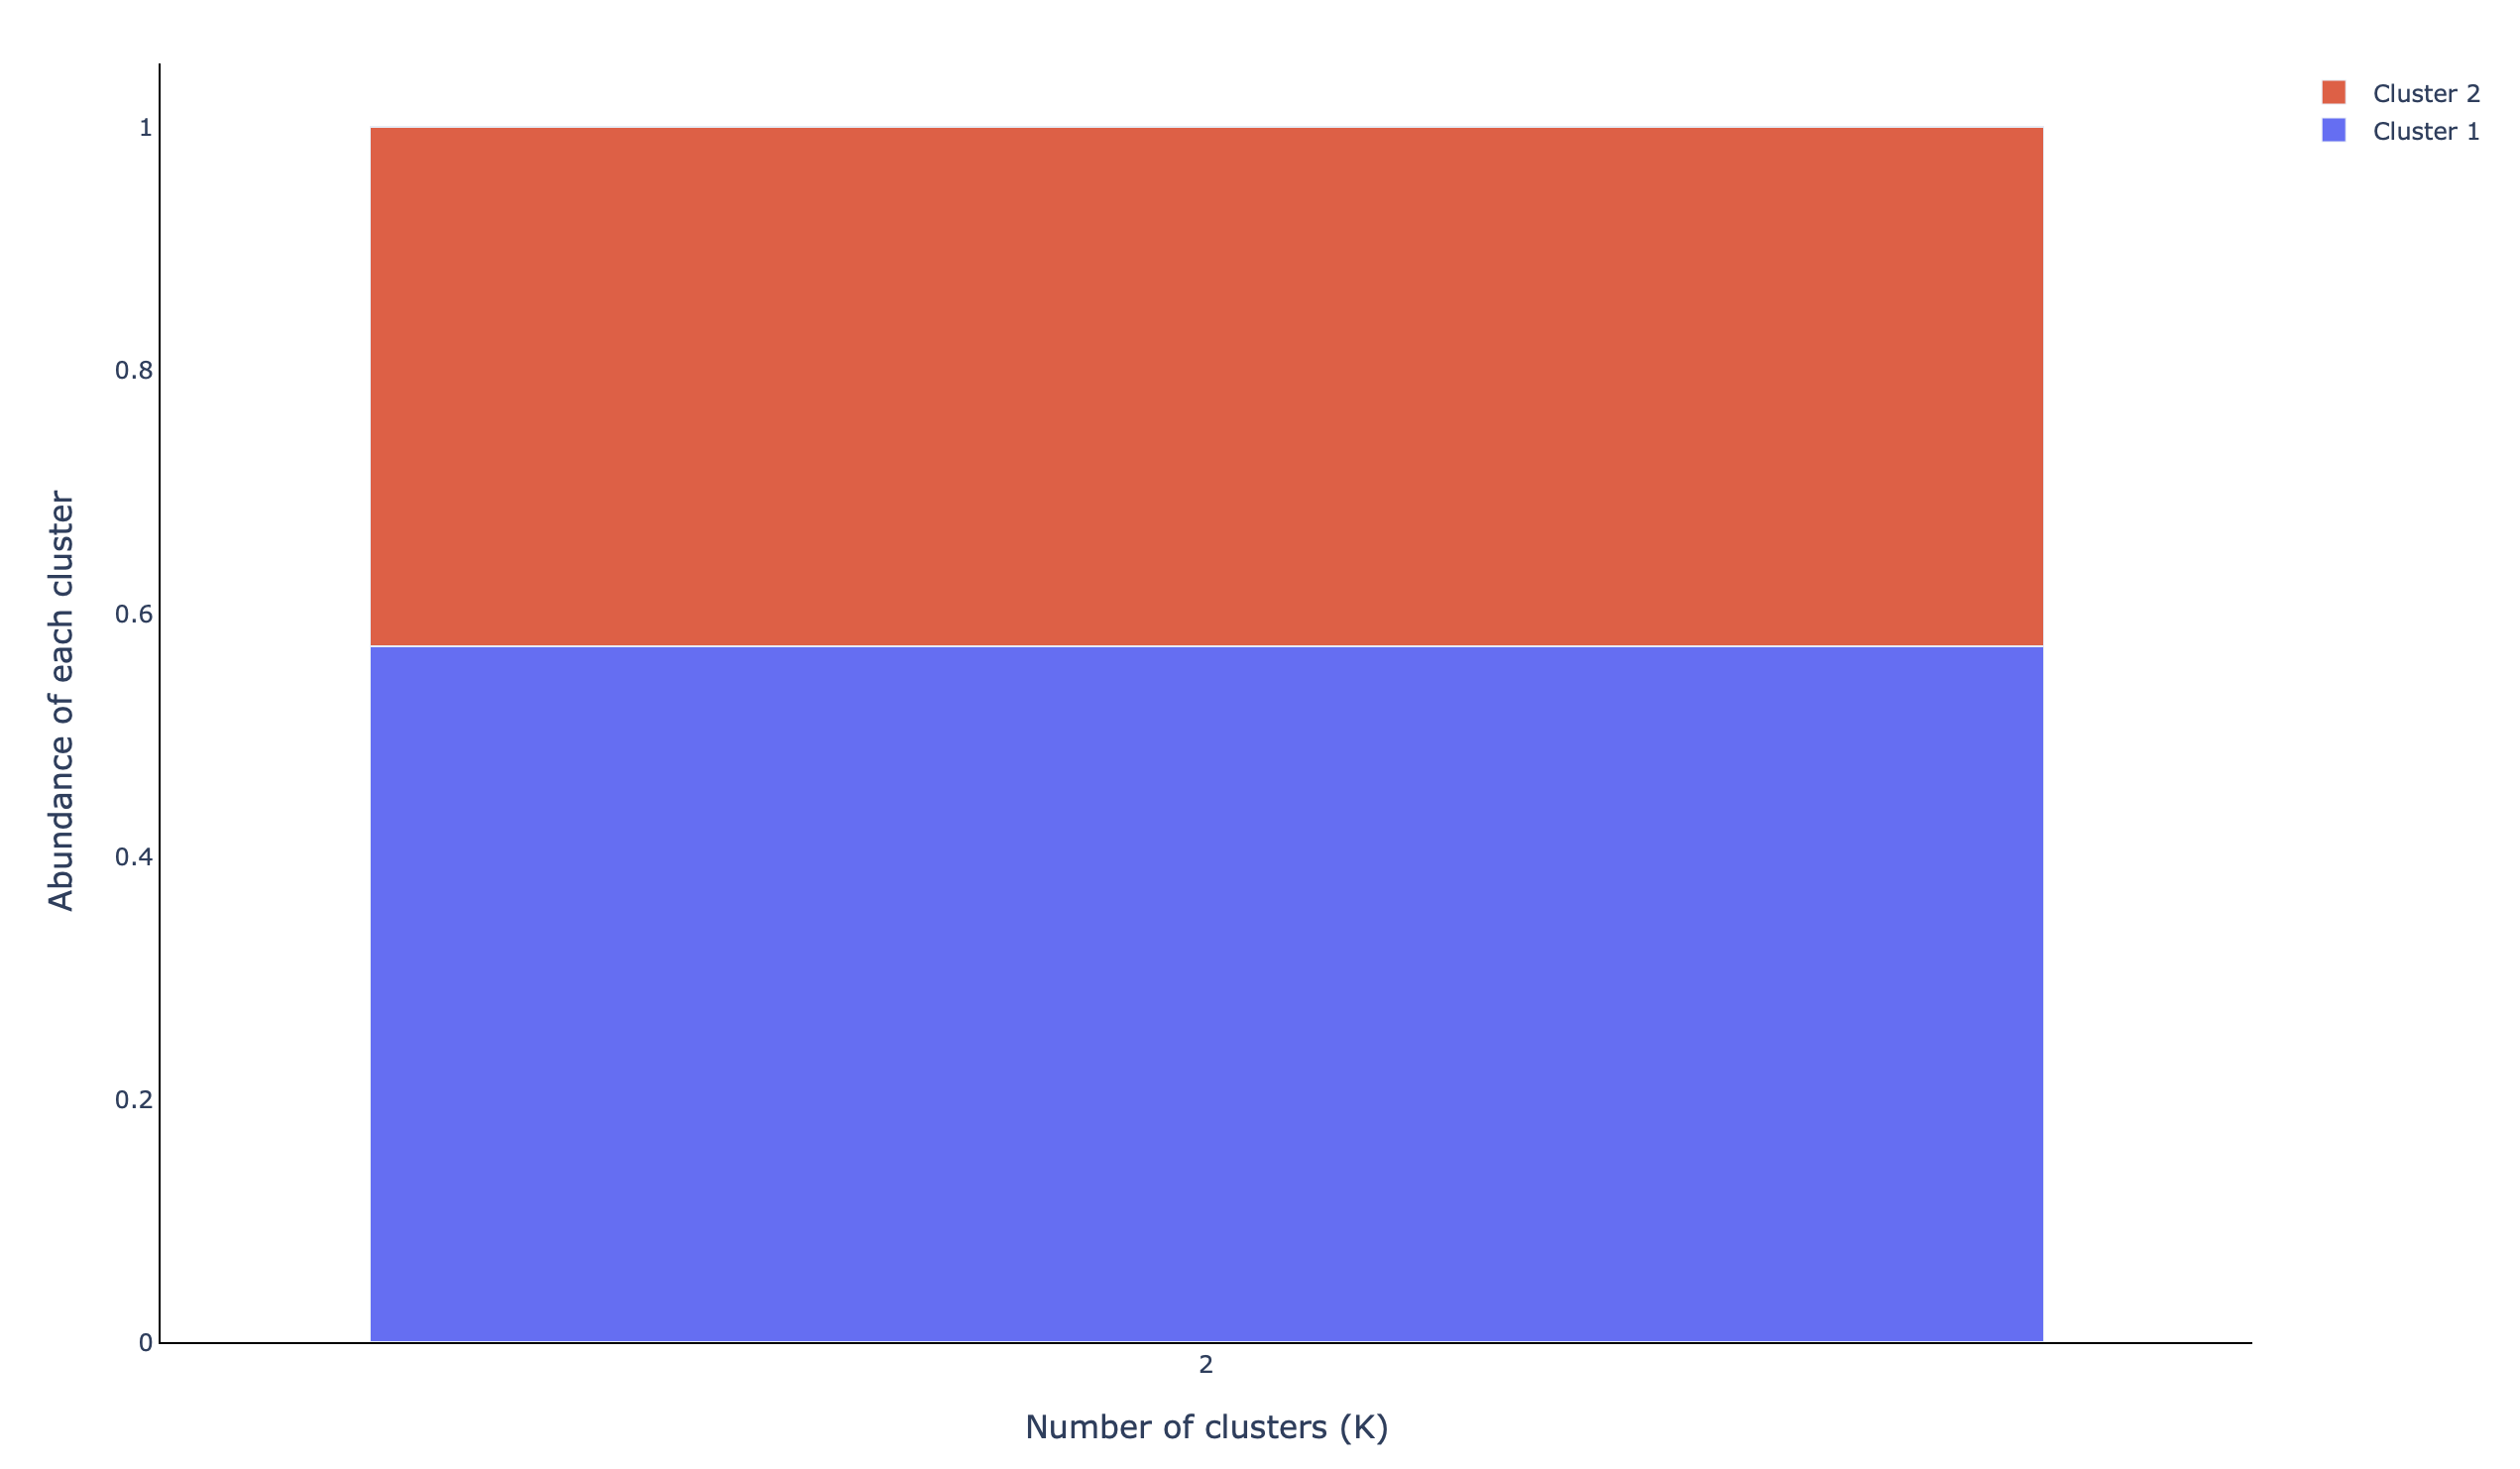
A stacked barplot depicting the abundance of each cluster found (abundance_clustered):
The plots that were shown in the single-end tutorial are also provided for each cluster, i.e. the barplot with the mutation rate per base in the unmasked positions (
profile_filtered_m-ratio):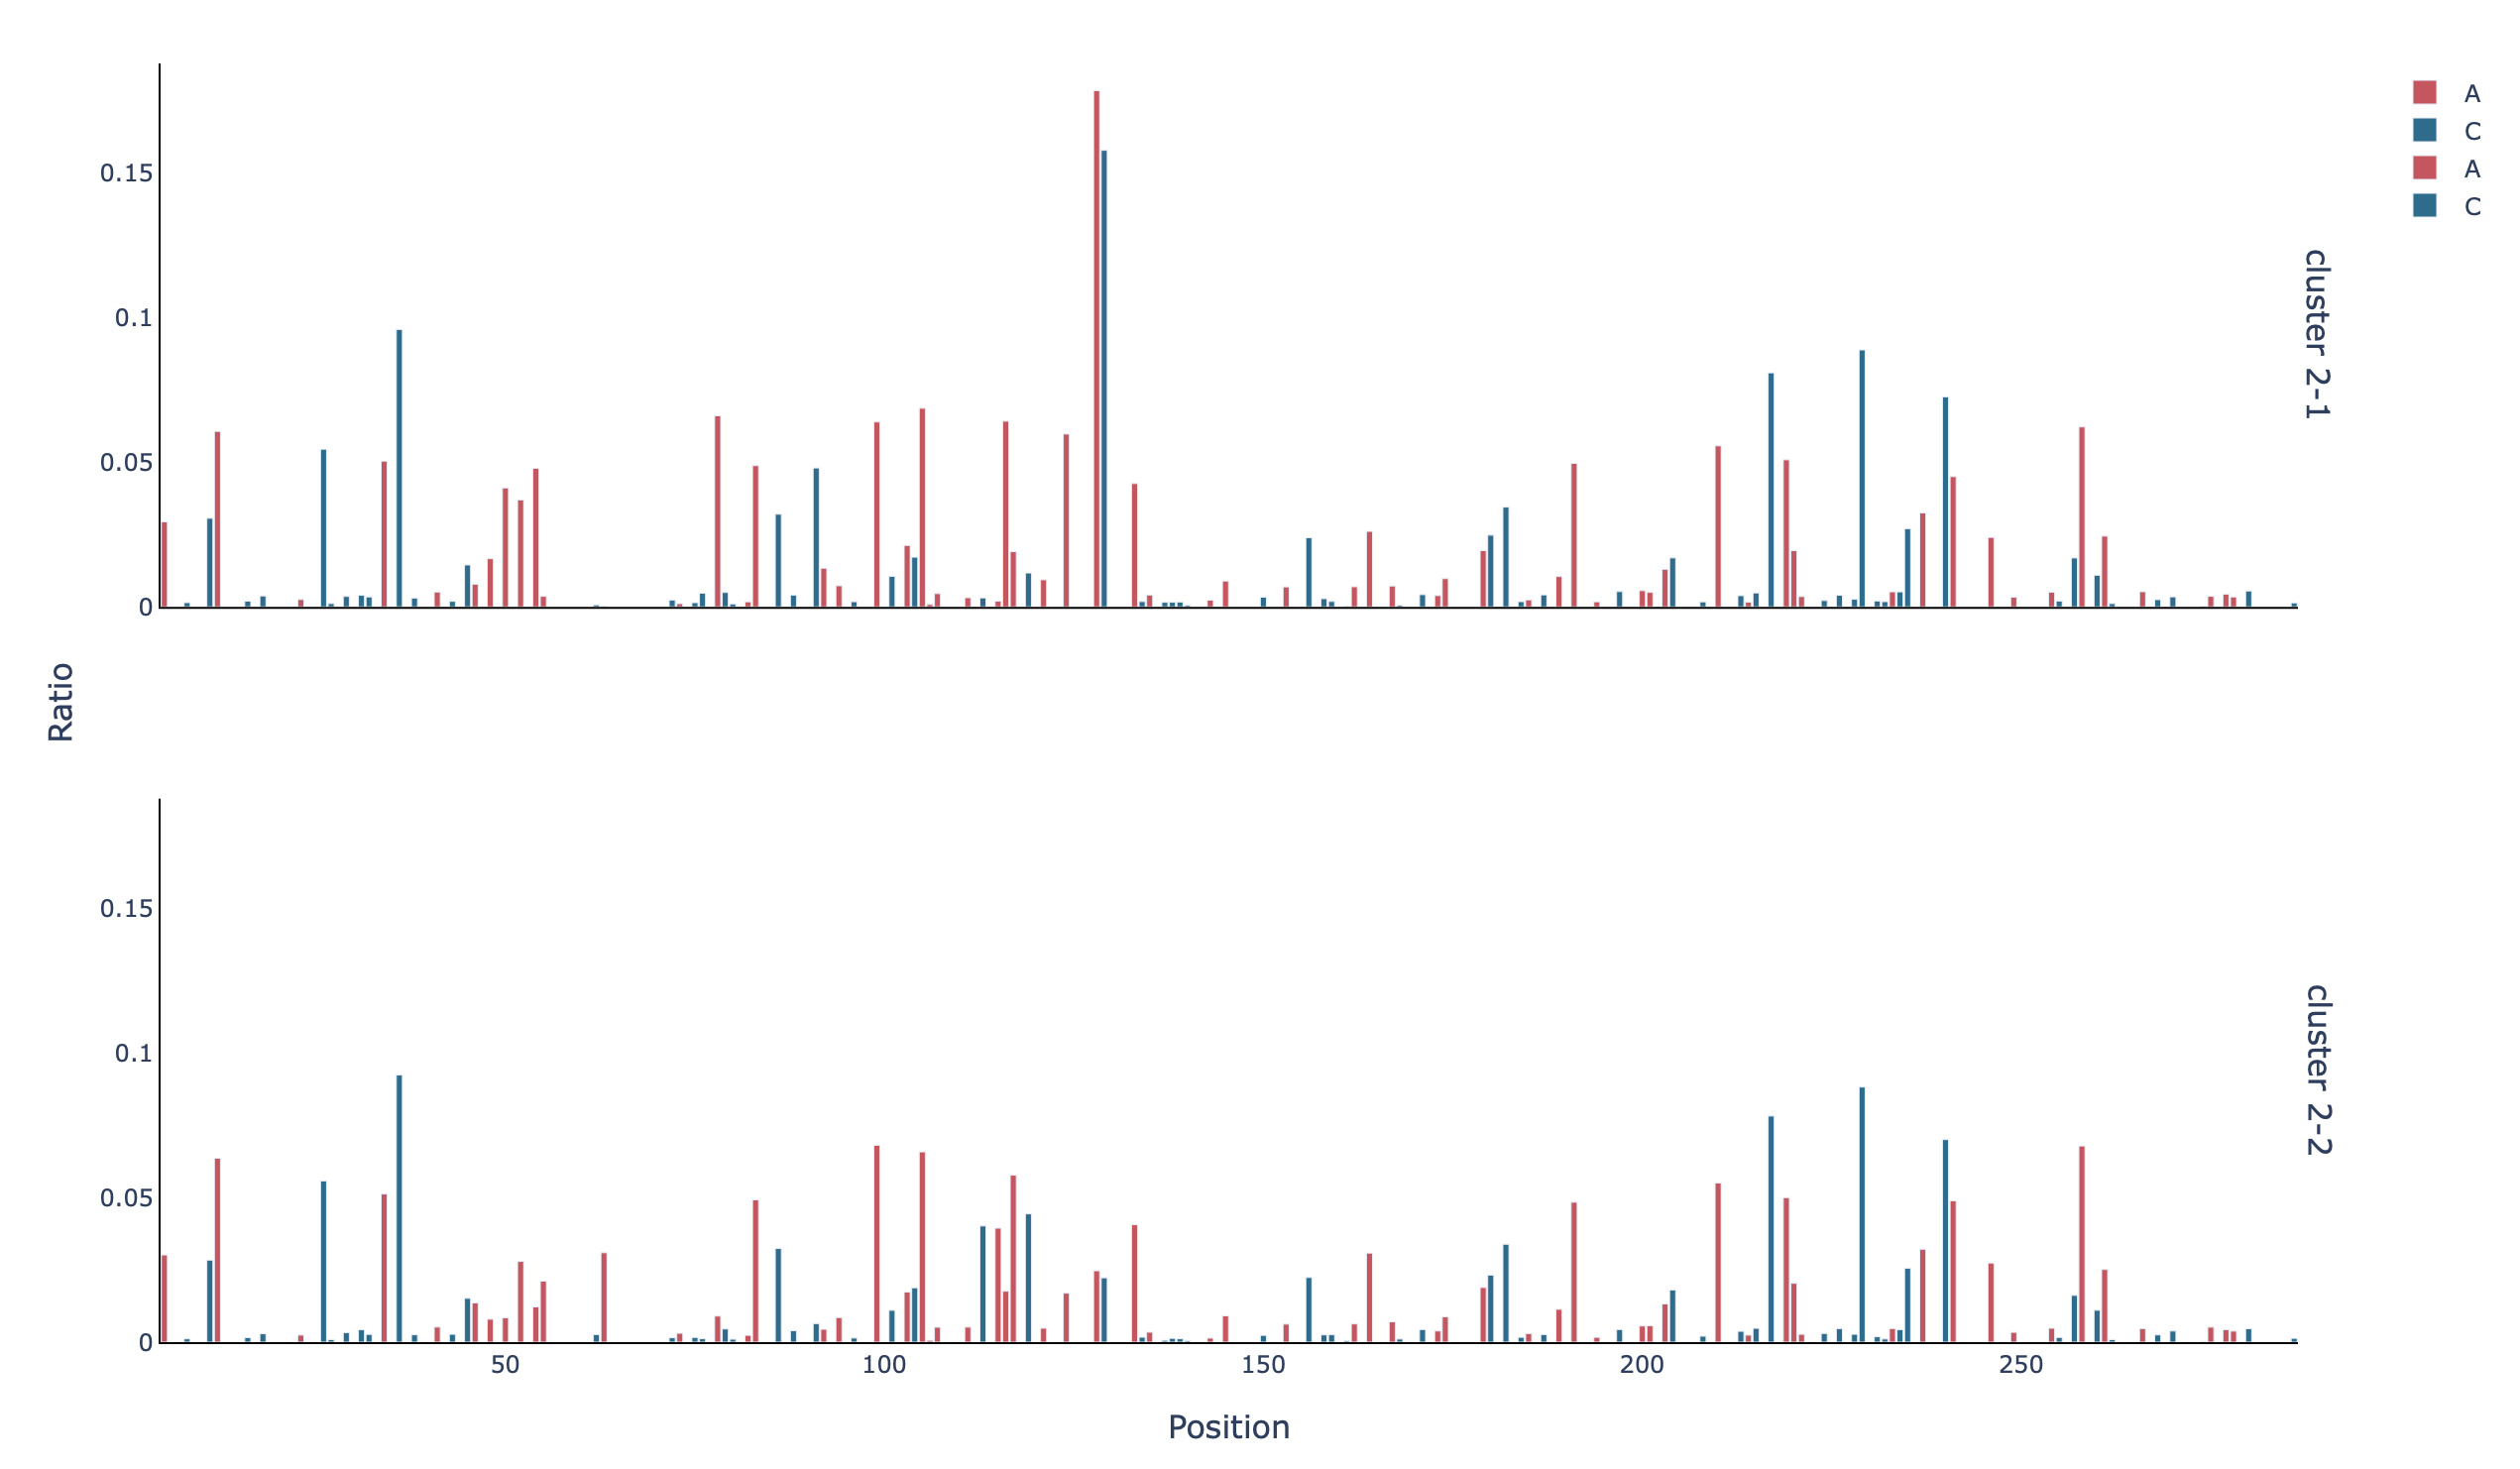
Further analysis
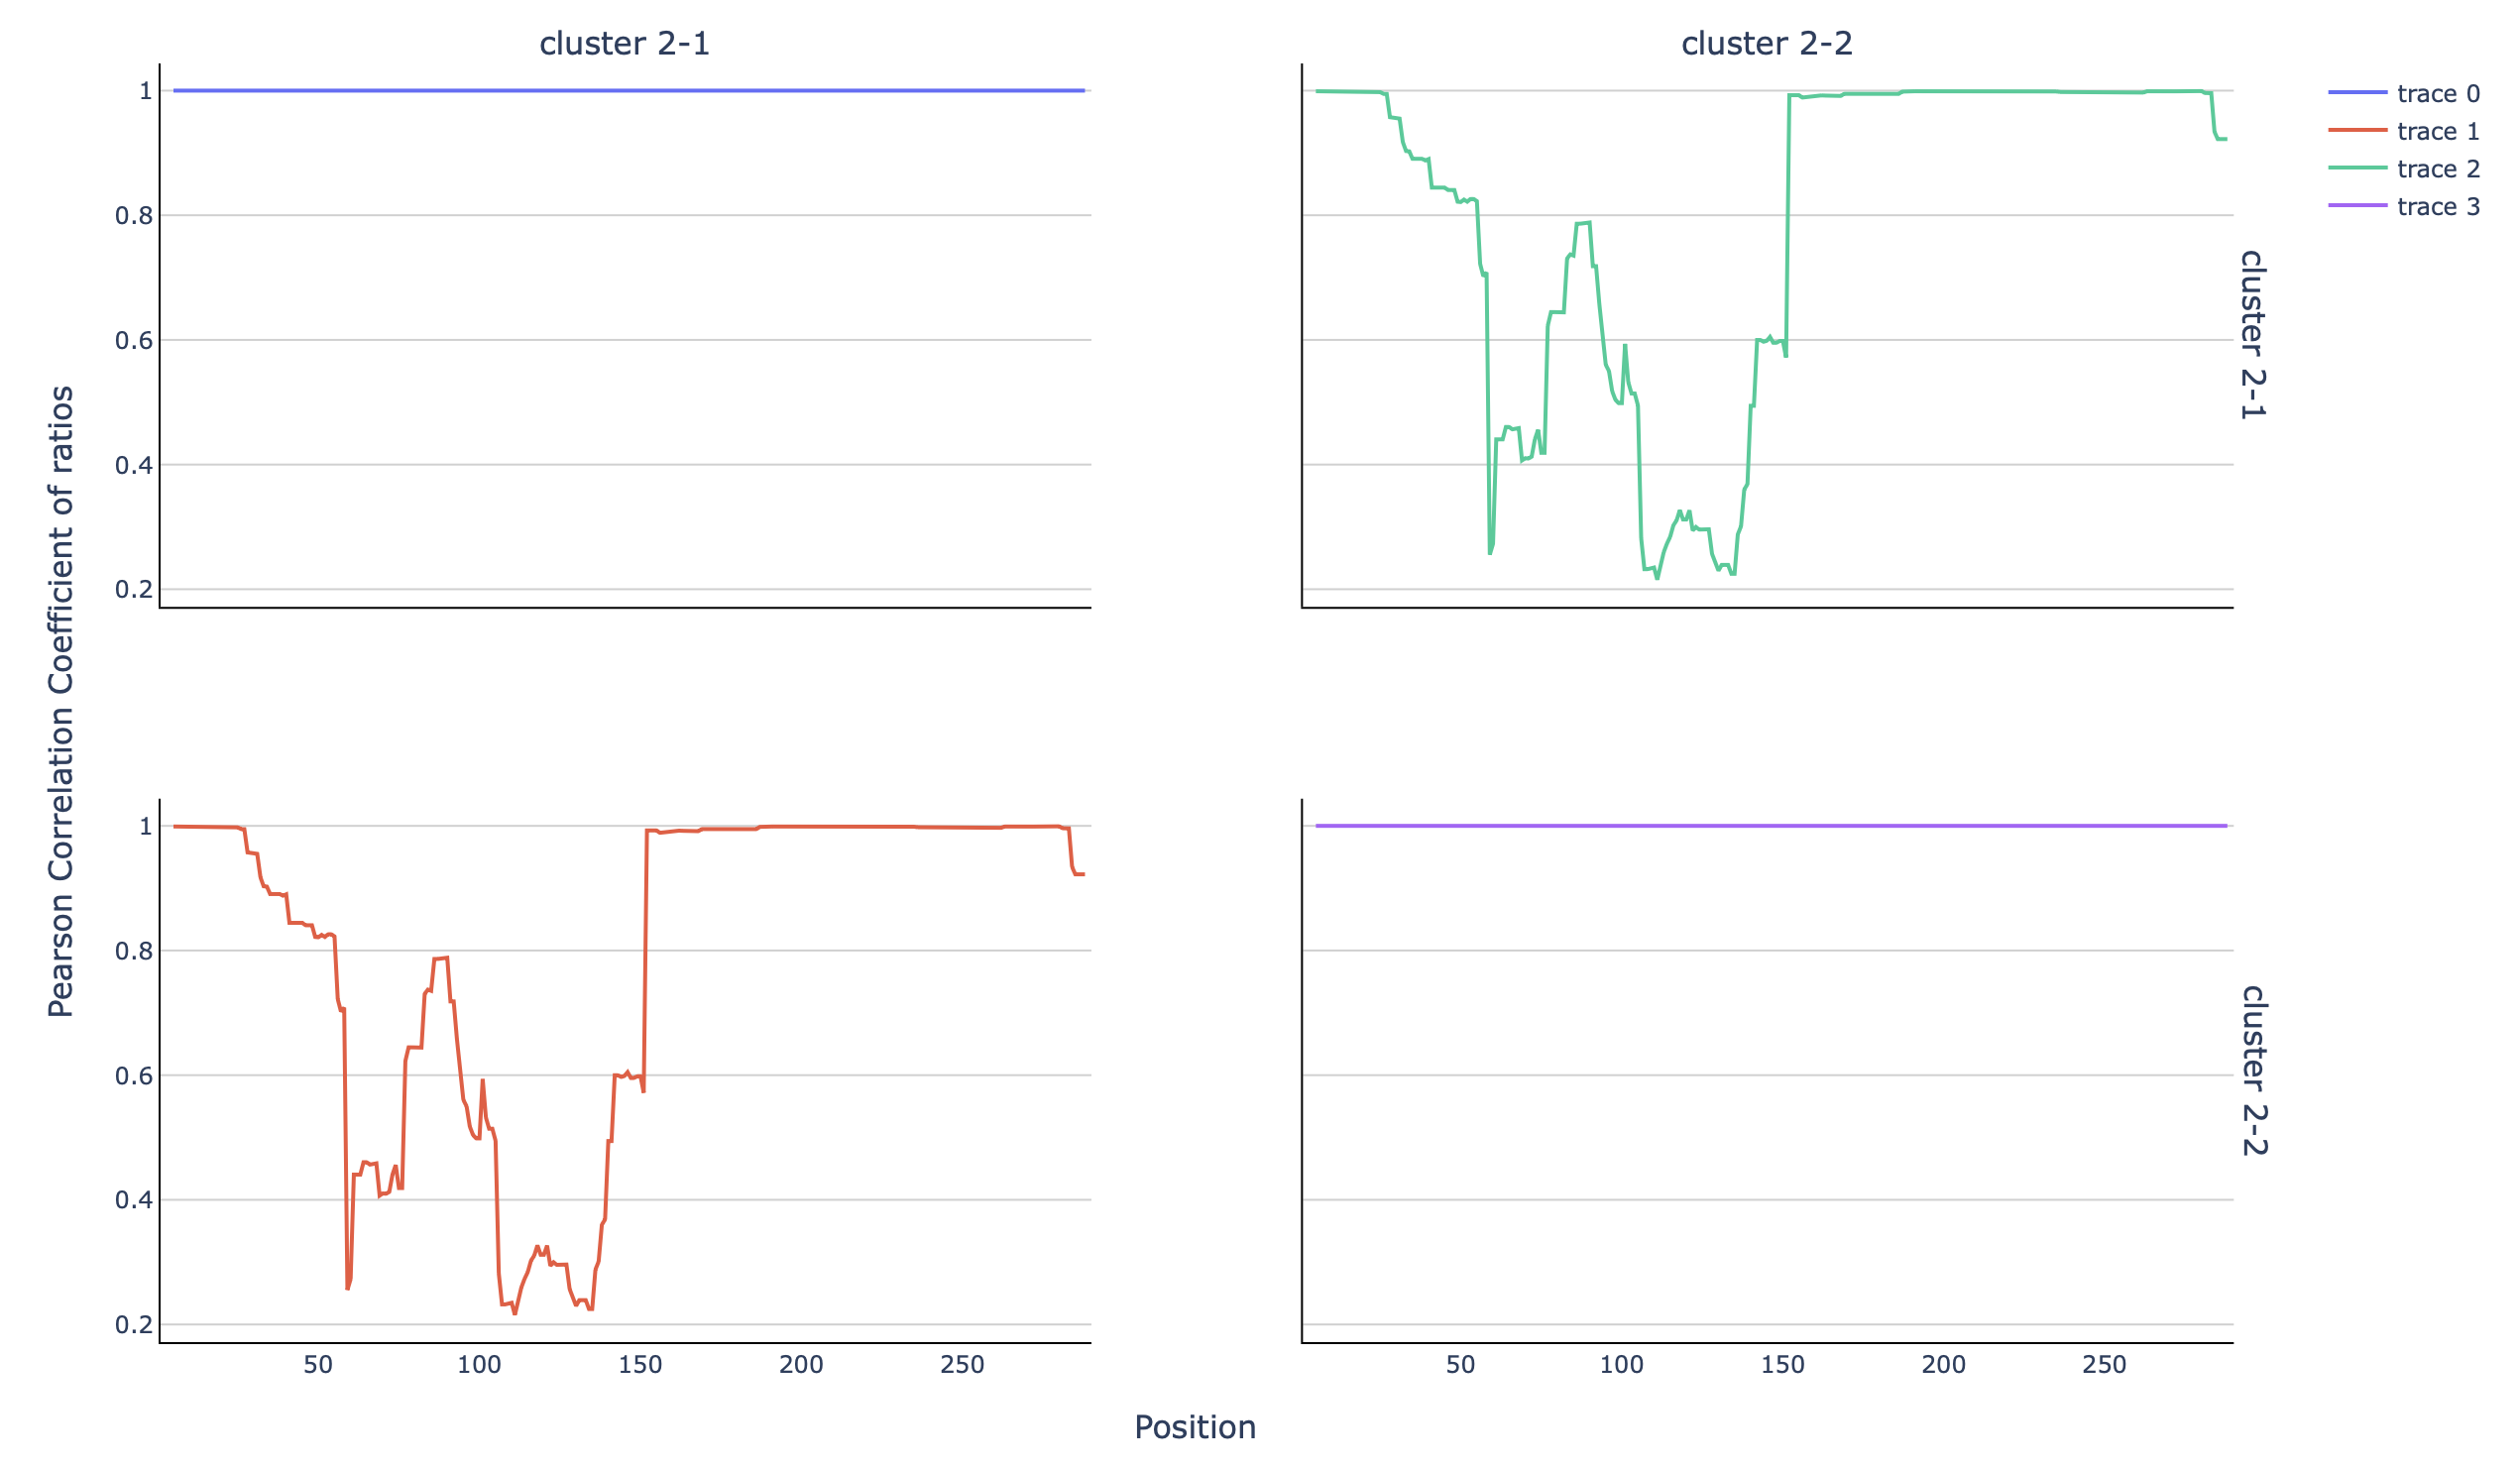
SEISMIC-RNA also allows for further analysis. For instance, a rolling
correlation plot can be done, comparing the clusters. For that, the seismic graph
function can be used:
seismic graph corroll out/sim_clustering_ref/cluster/sim_clustering_ref/full/cluster-position-table.csv --compself
Where corroll indicated the type of plot (rolling correlation,
see Command Line Reference for more information), and --compself indicated that
the comparison ought to be done of the clusters in the same table (as opposed
to comparing samples in different tables).