Example 1) Running a sample with a single-end FASTQ
In this first example, basic instructions to run a single-end FASTQ file using the entire SEISMIC-RNA workflow are provided.
Download example file
A single-end FASTQ file was generated using seismic sim. The file, with
its corresponding reference fasta file, can be downloaded here:
https://raw.githubusercontent.com/rouskinlab/seismic-rna/main/src/userdocs/examples/Single_end_ref/fq/single_end.zip
Run the SEISMIC-RNA workflow
To run the entire workflow (seismic wf) on a single-end FASTQ file, you
only need to provide SEISMIC-RNA with a reference fasta file, the FASTQ file,
and the option -z:
seismic wf fq/sim_single_end.fa -z fq/sim_single_end_ref.fq.gz --fold --draw --export
The other flags are included to fold the sequence using the calculated mutation
rates as constraints (--fold), generate a model of the folded sequence
(--draw), and export the results in .json format for loading into SEISMICgraph (--export).
Output
SEISMIC-RNA will automatically create the index, align, relate, mask, and produce a number of graphs (see How SEISMIC-RNA Works). By default, the graphs that are provided are:
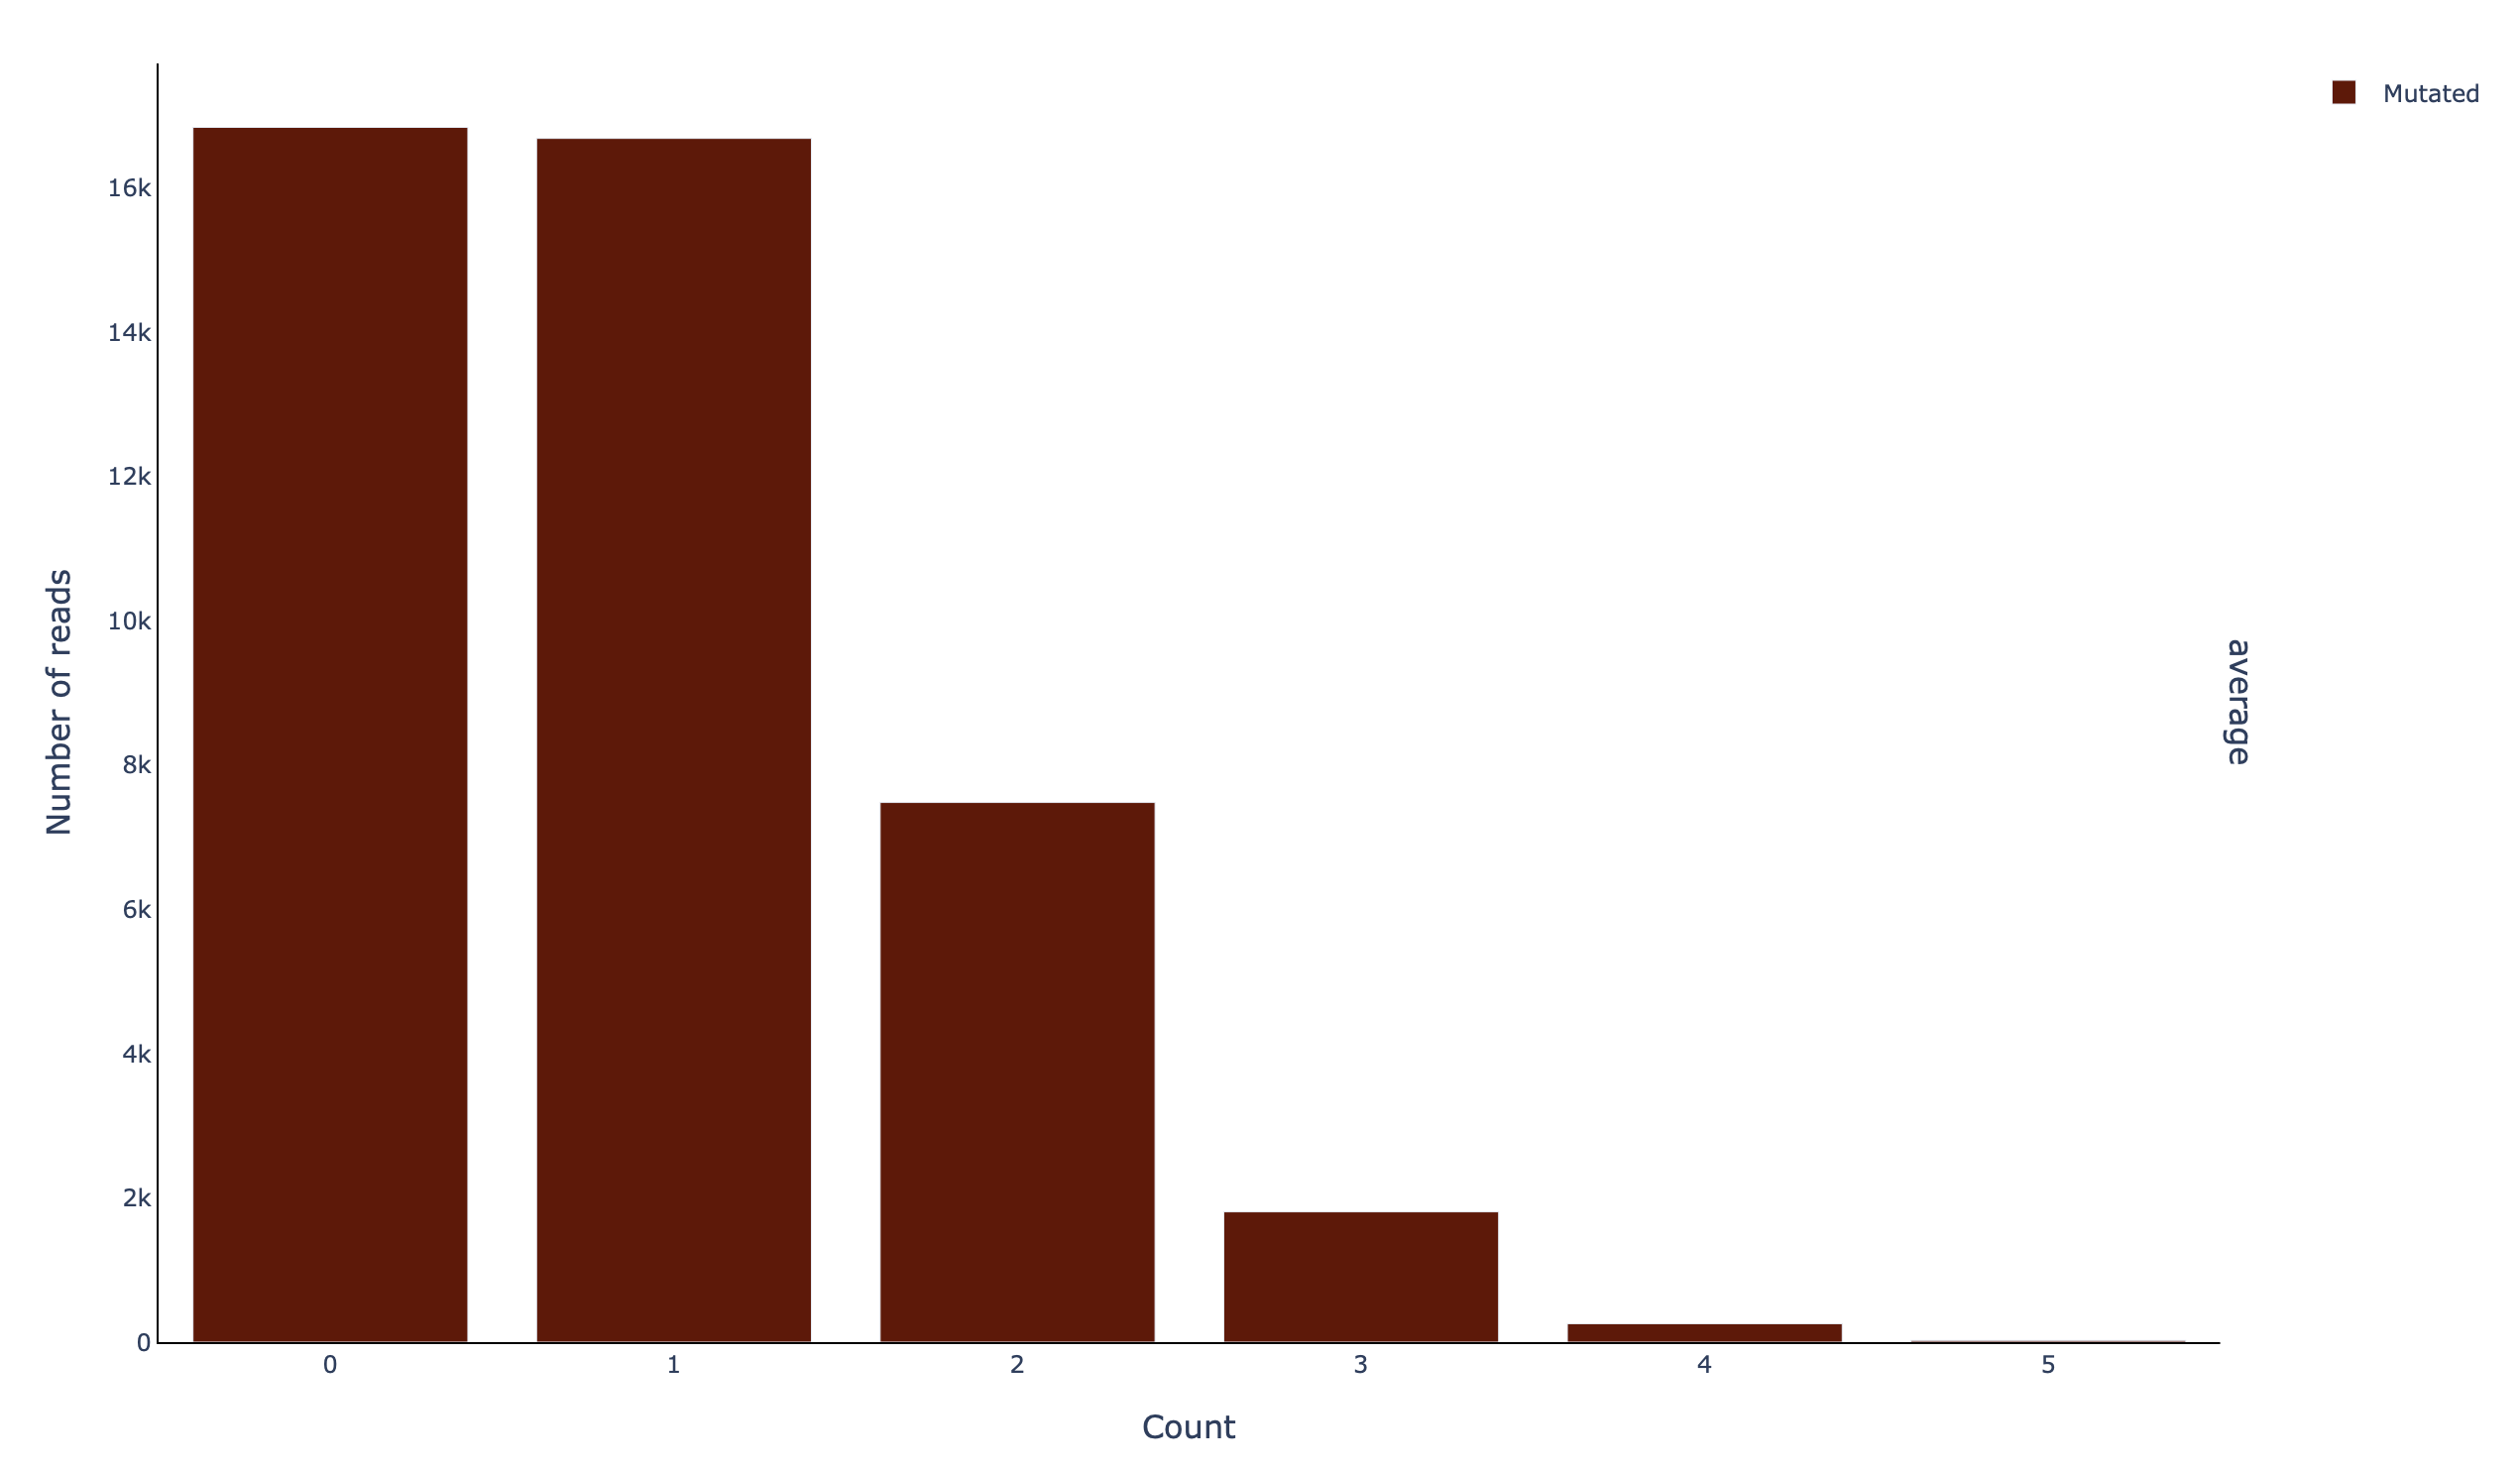
A histogram of the mutations per read (histread_filtered_m-count):
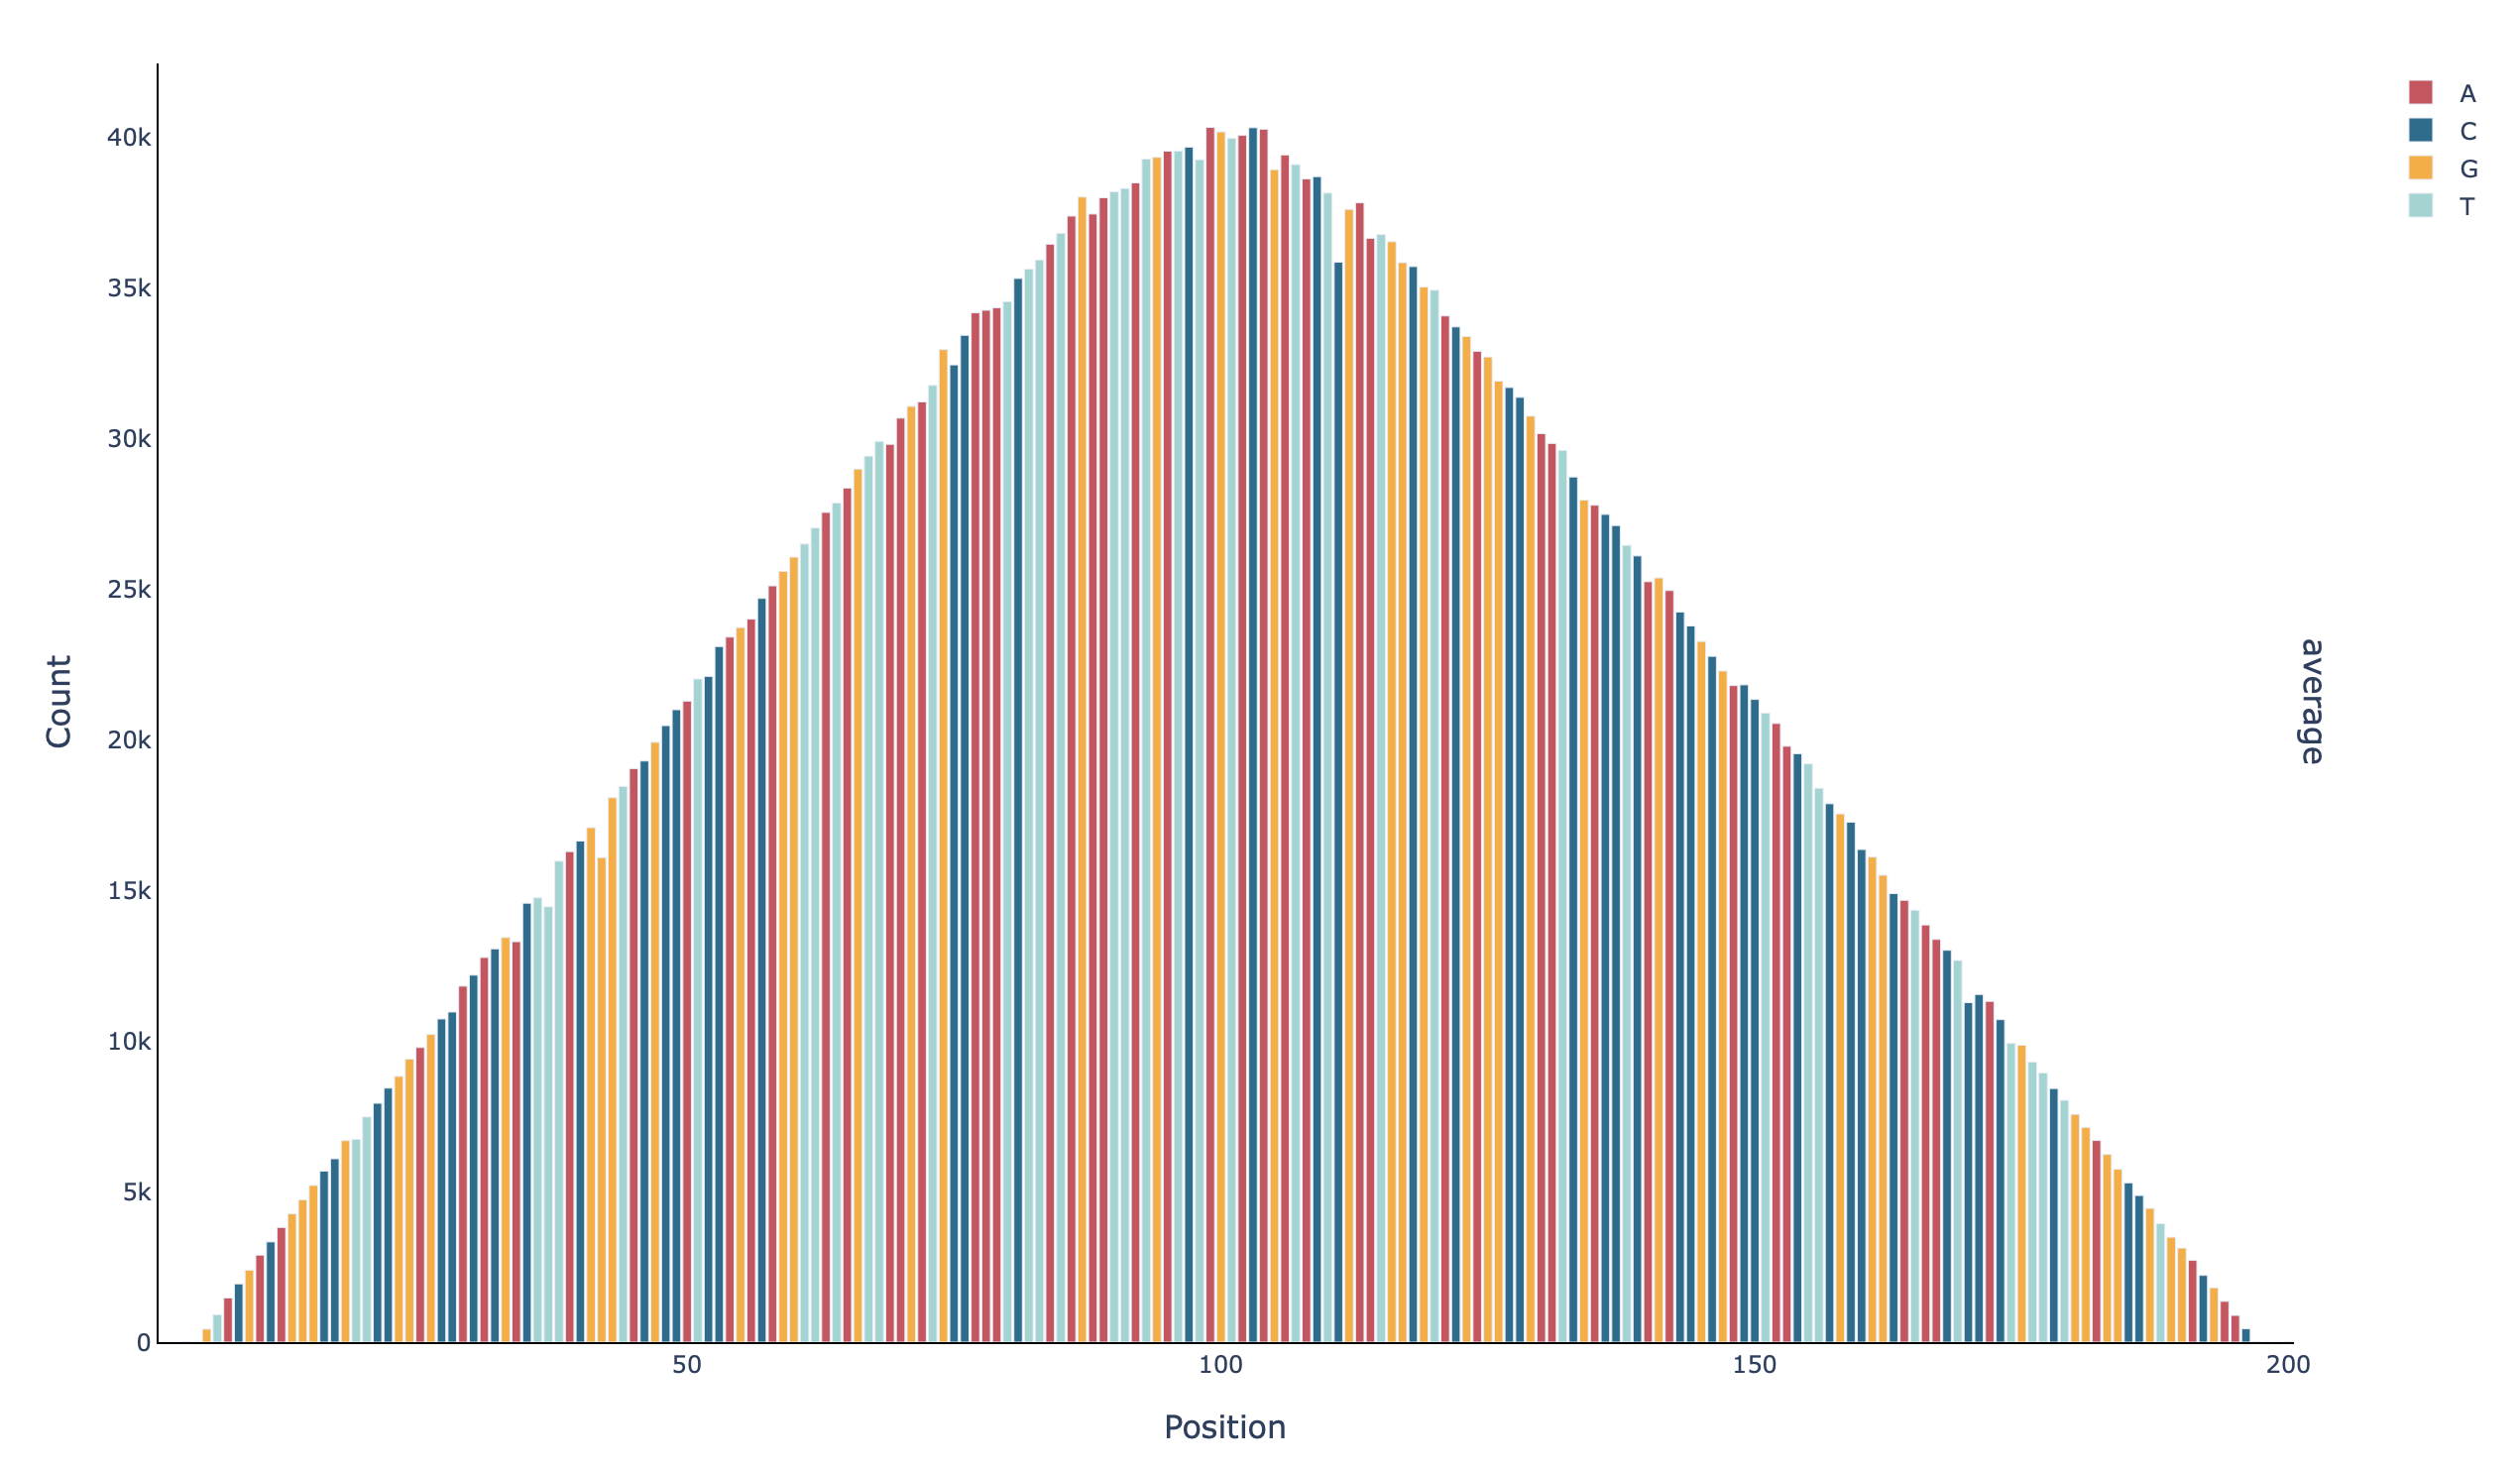
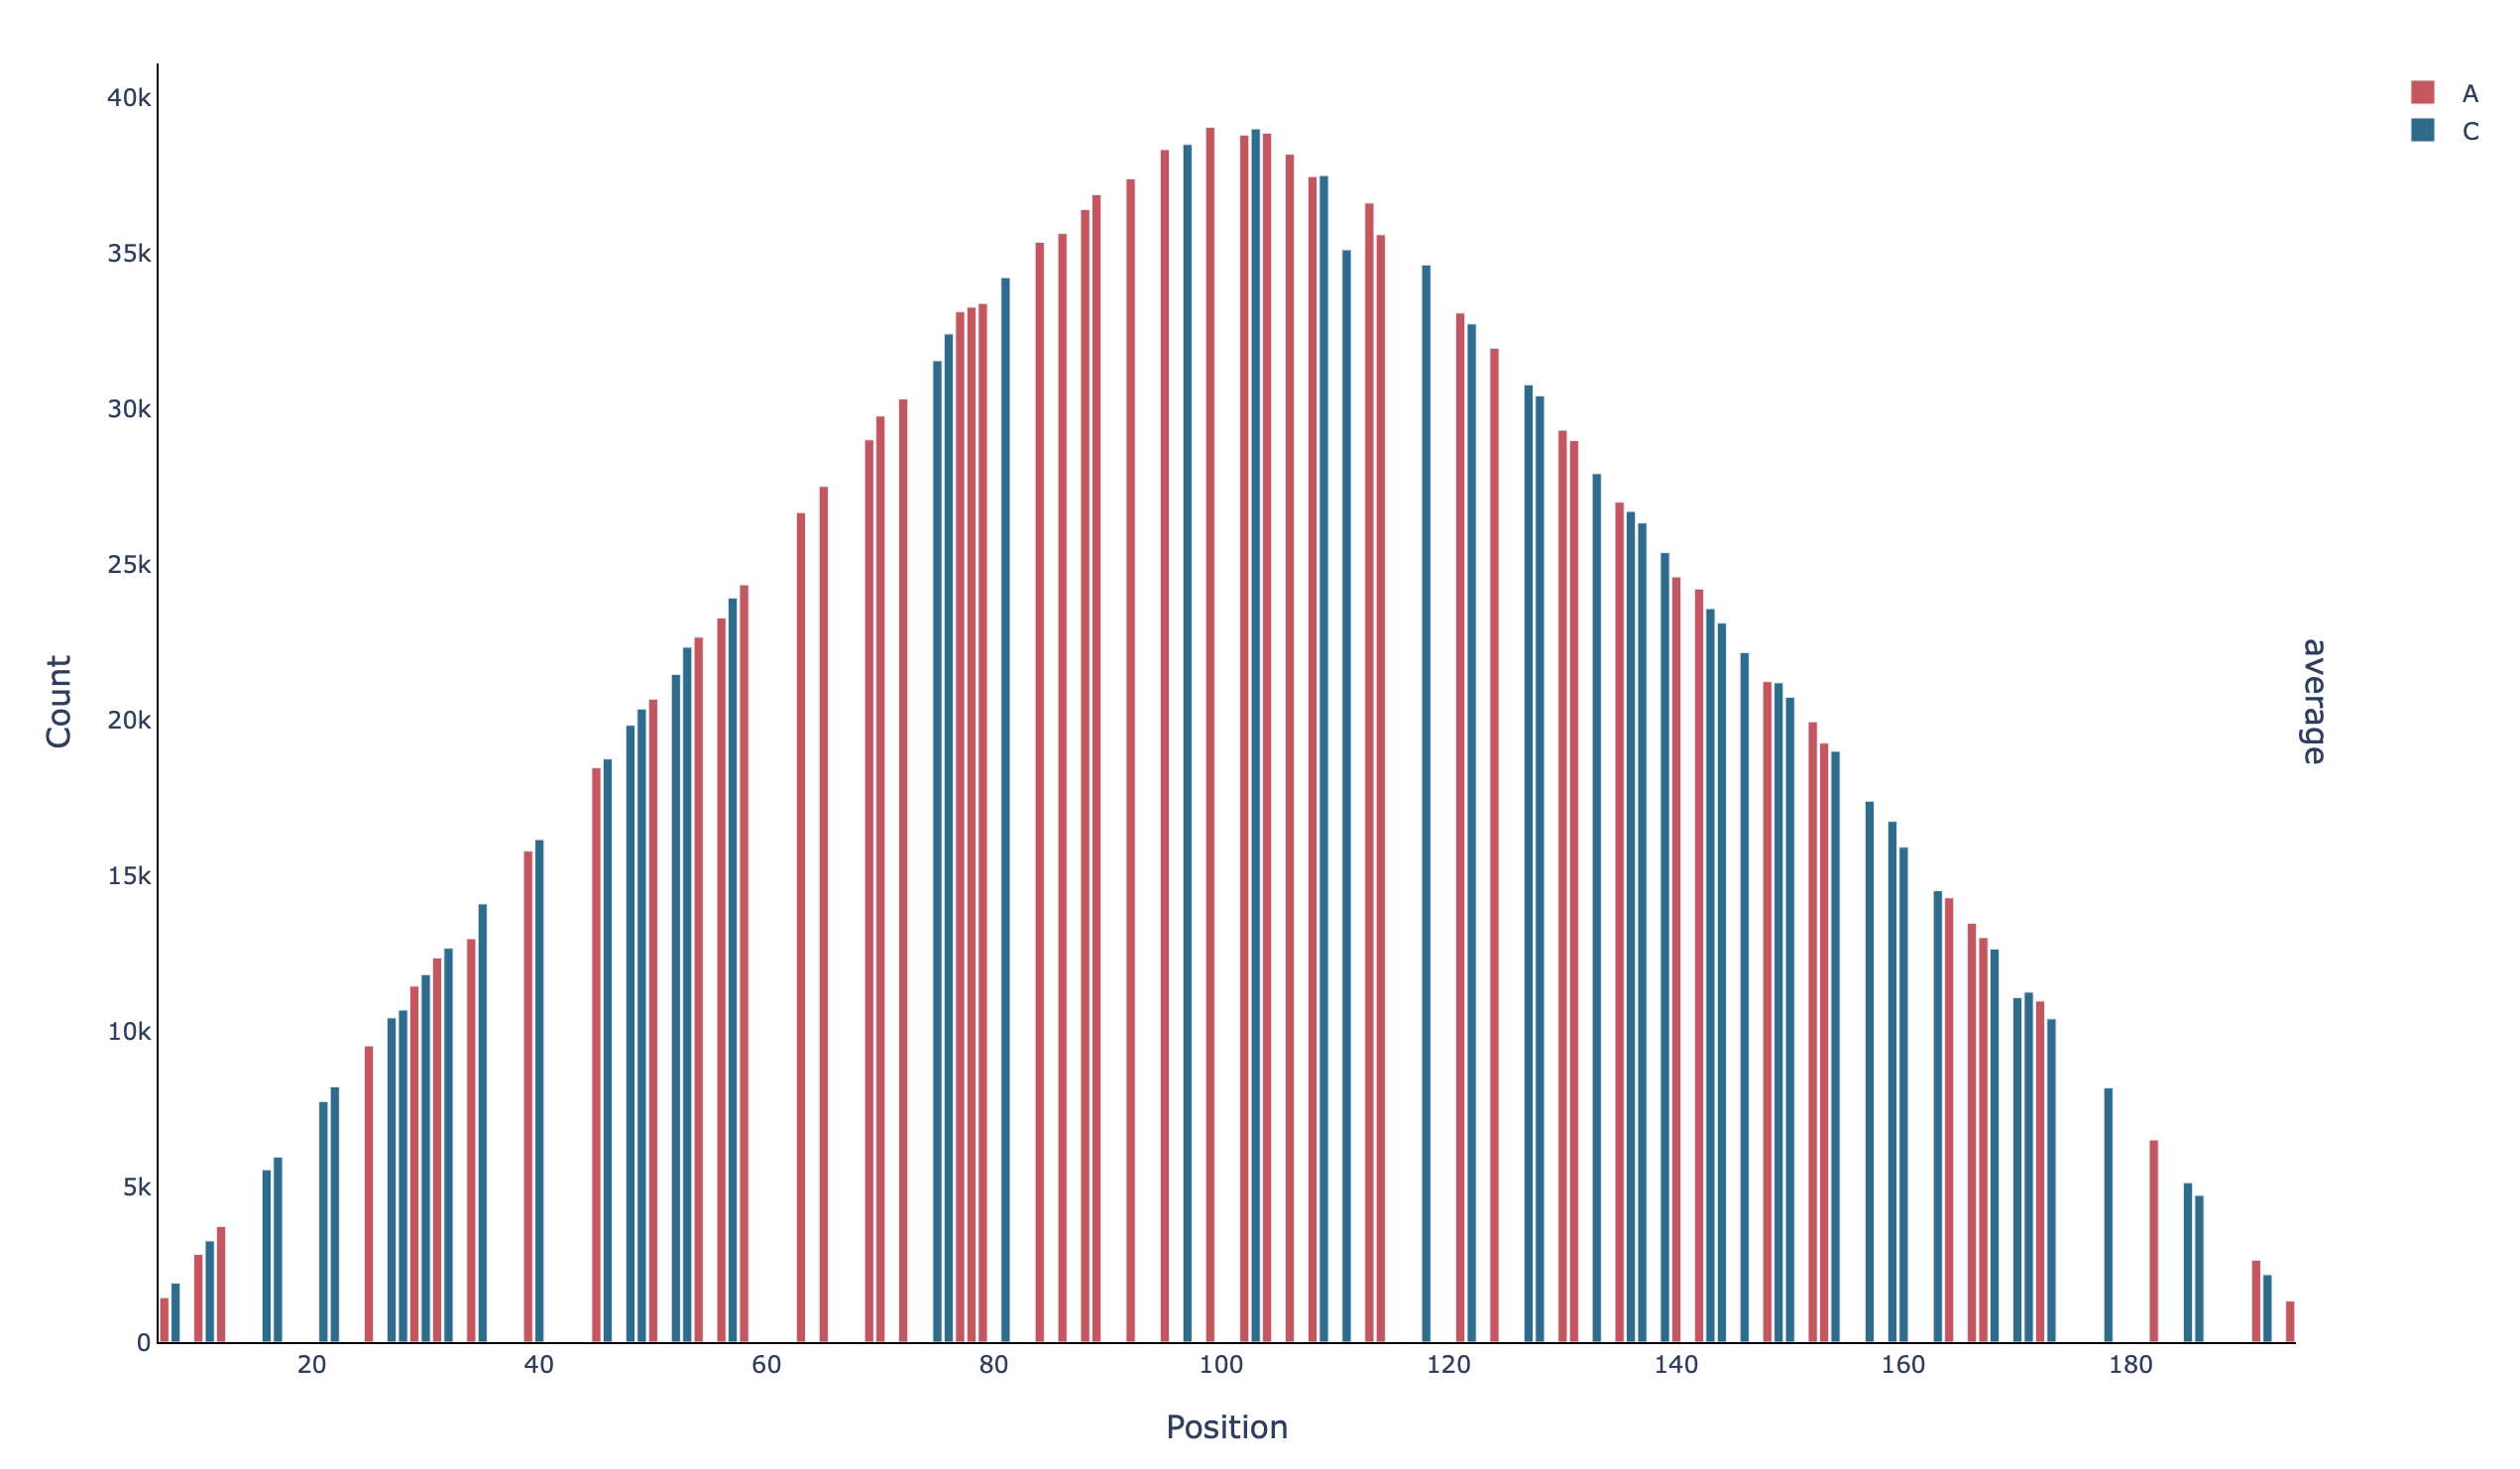
A barplot with the coverage per base in all positions (profile_all_n-count):
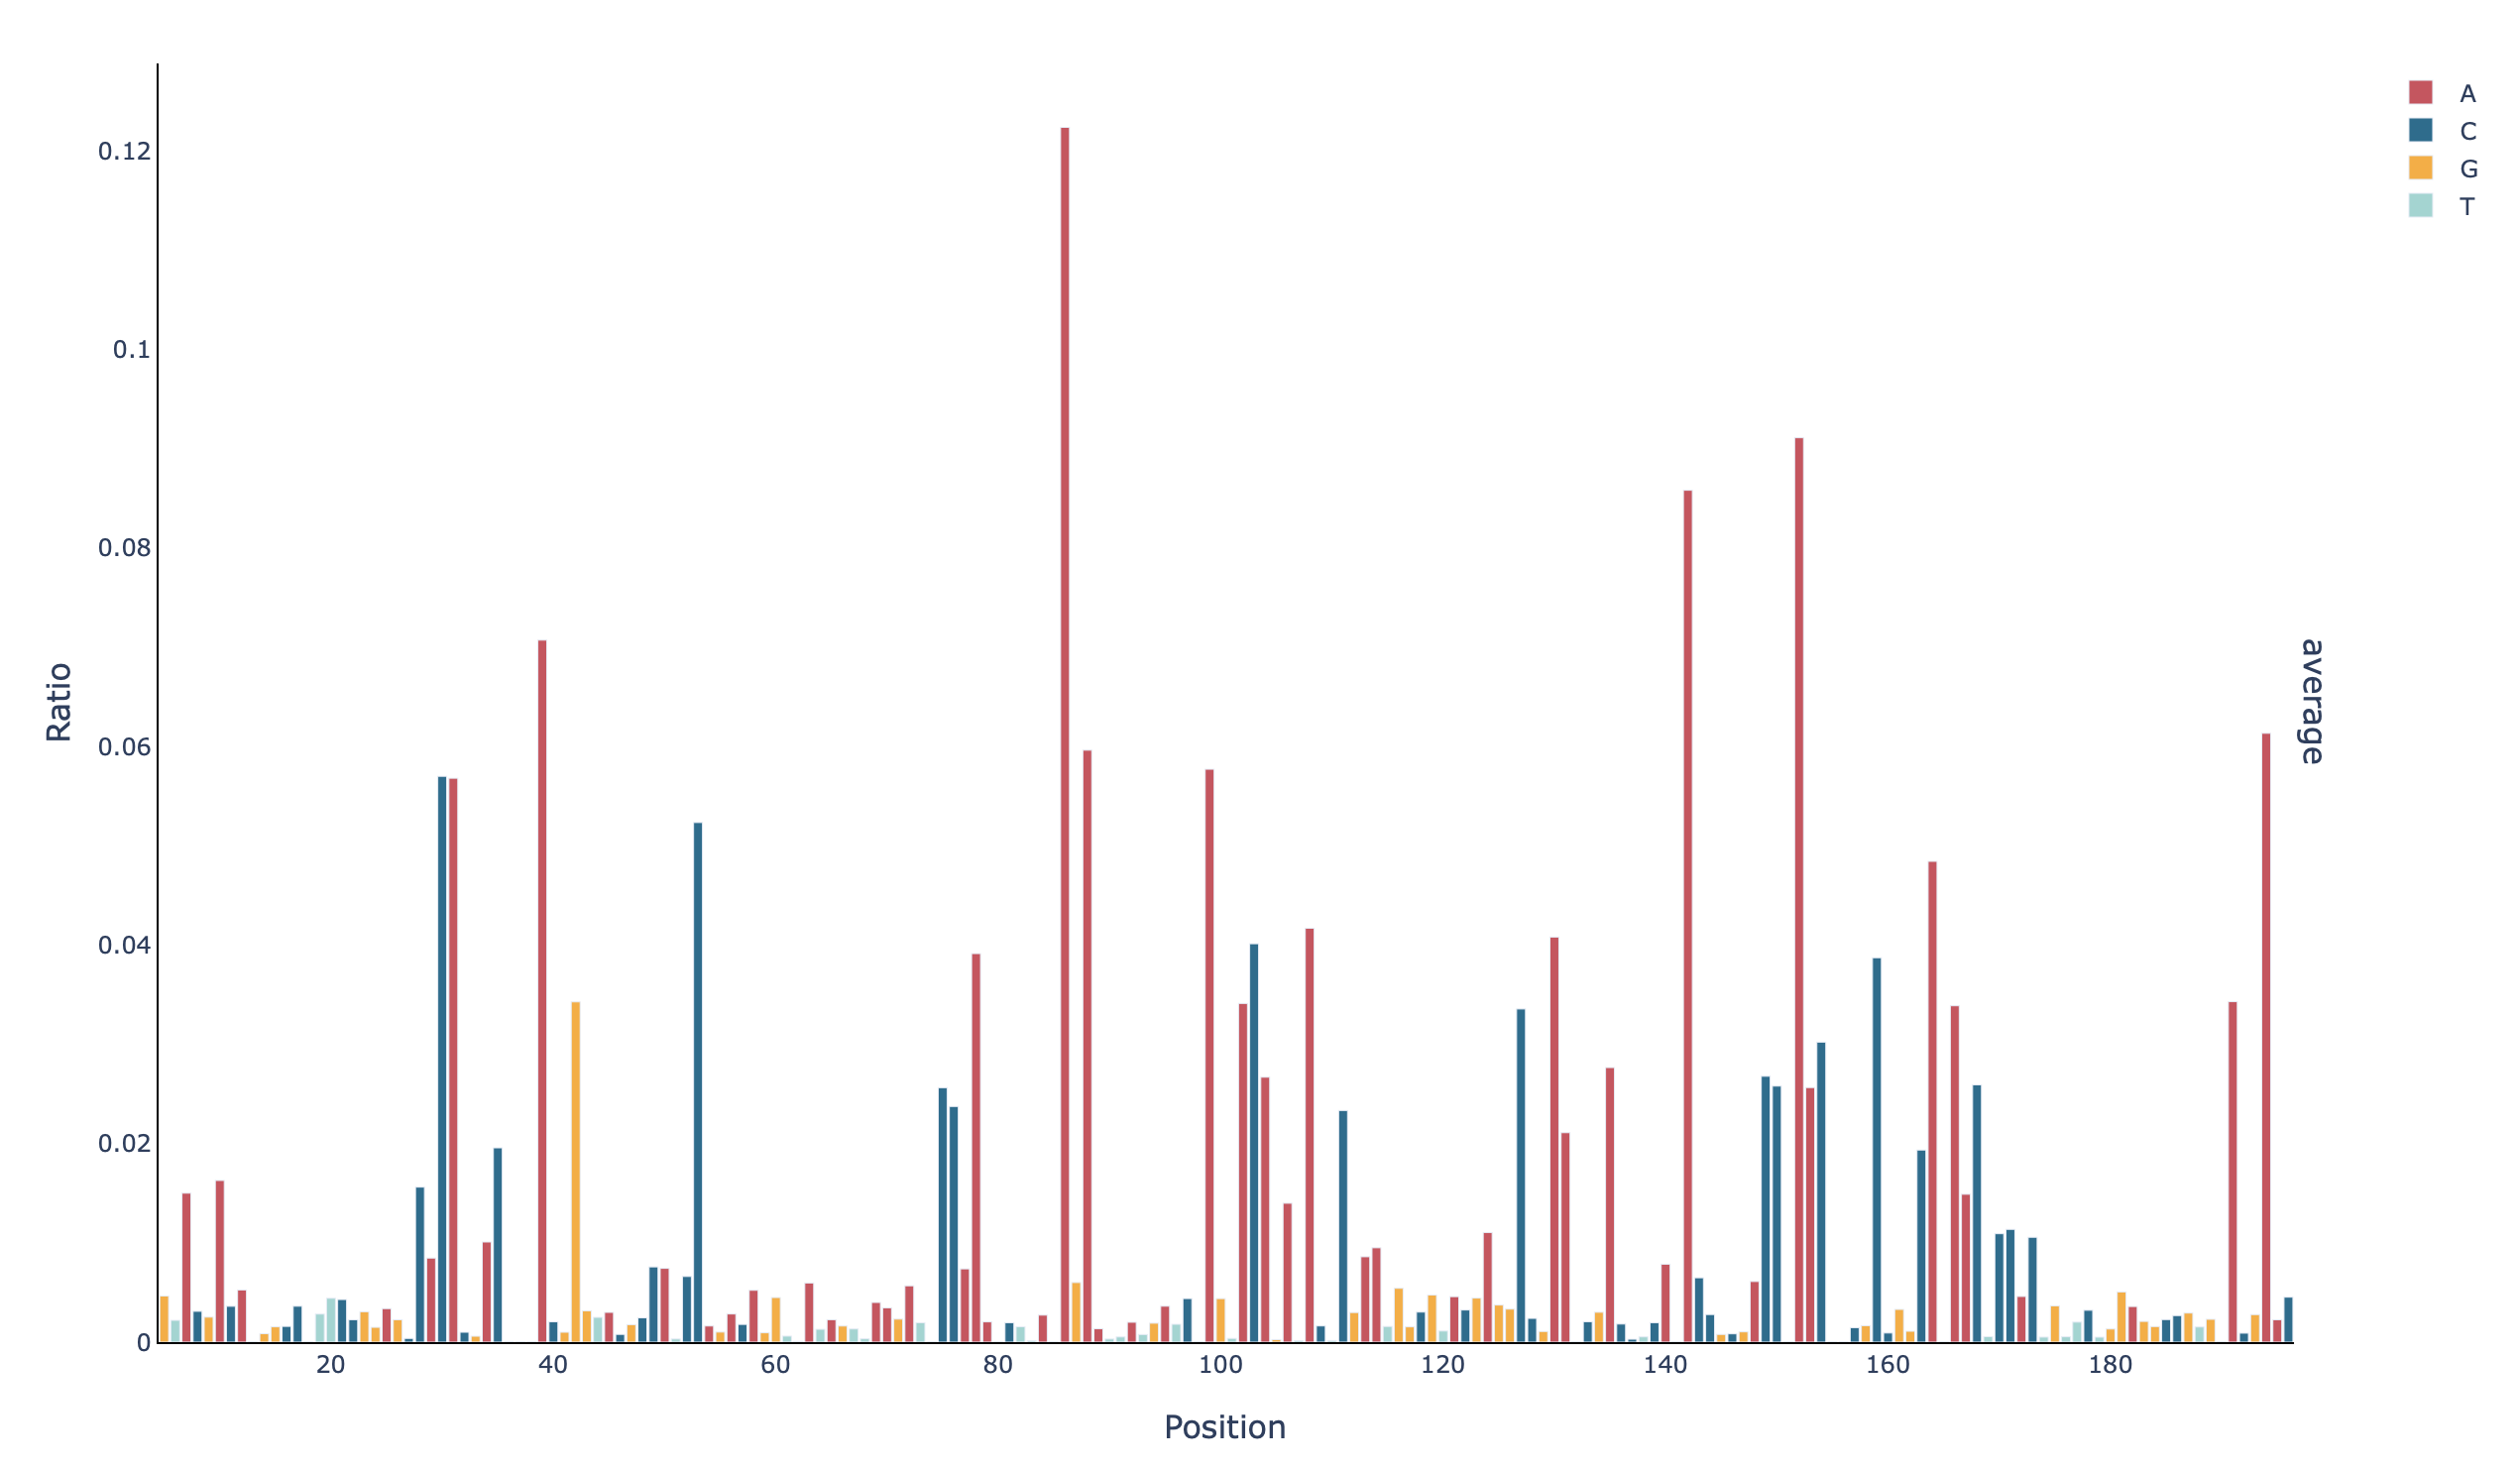
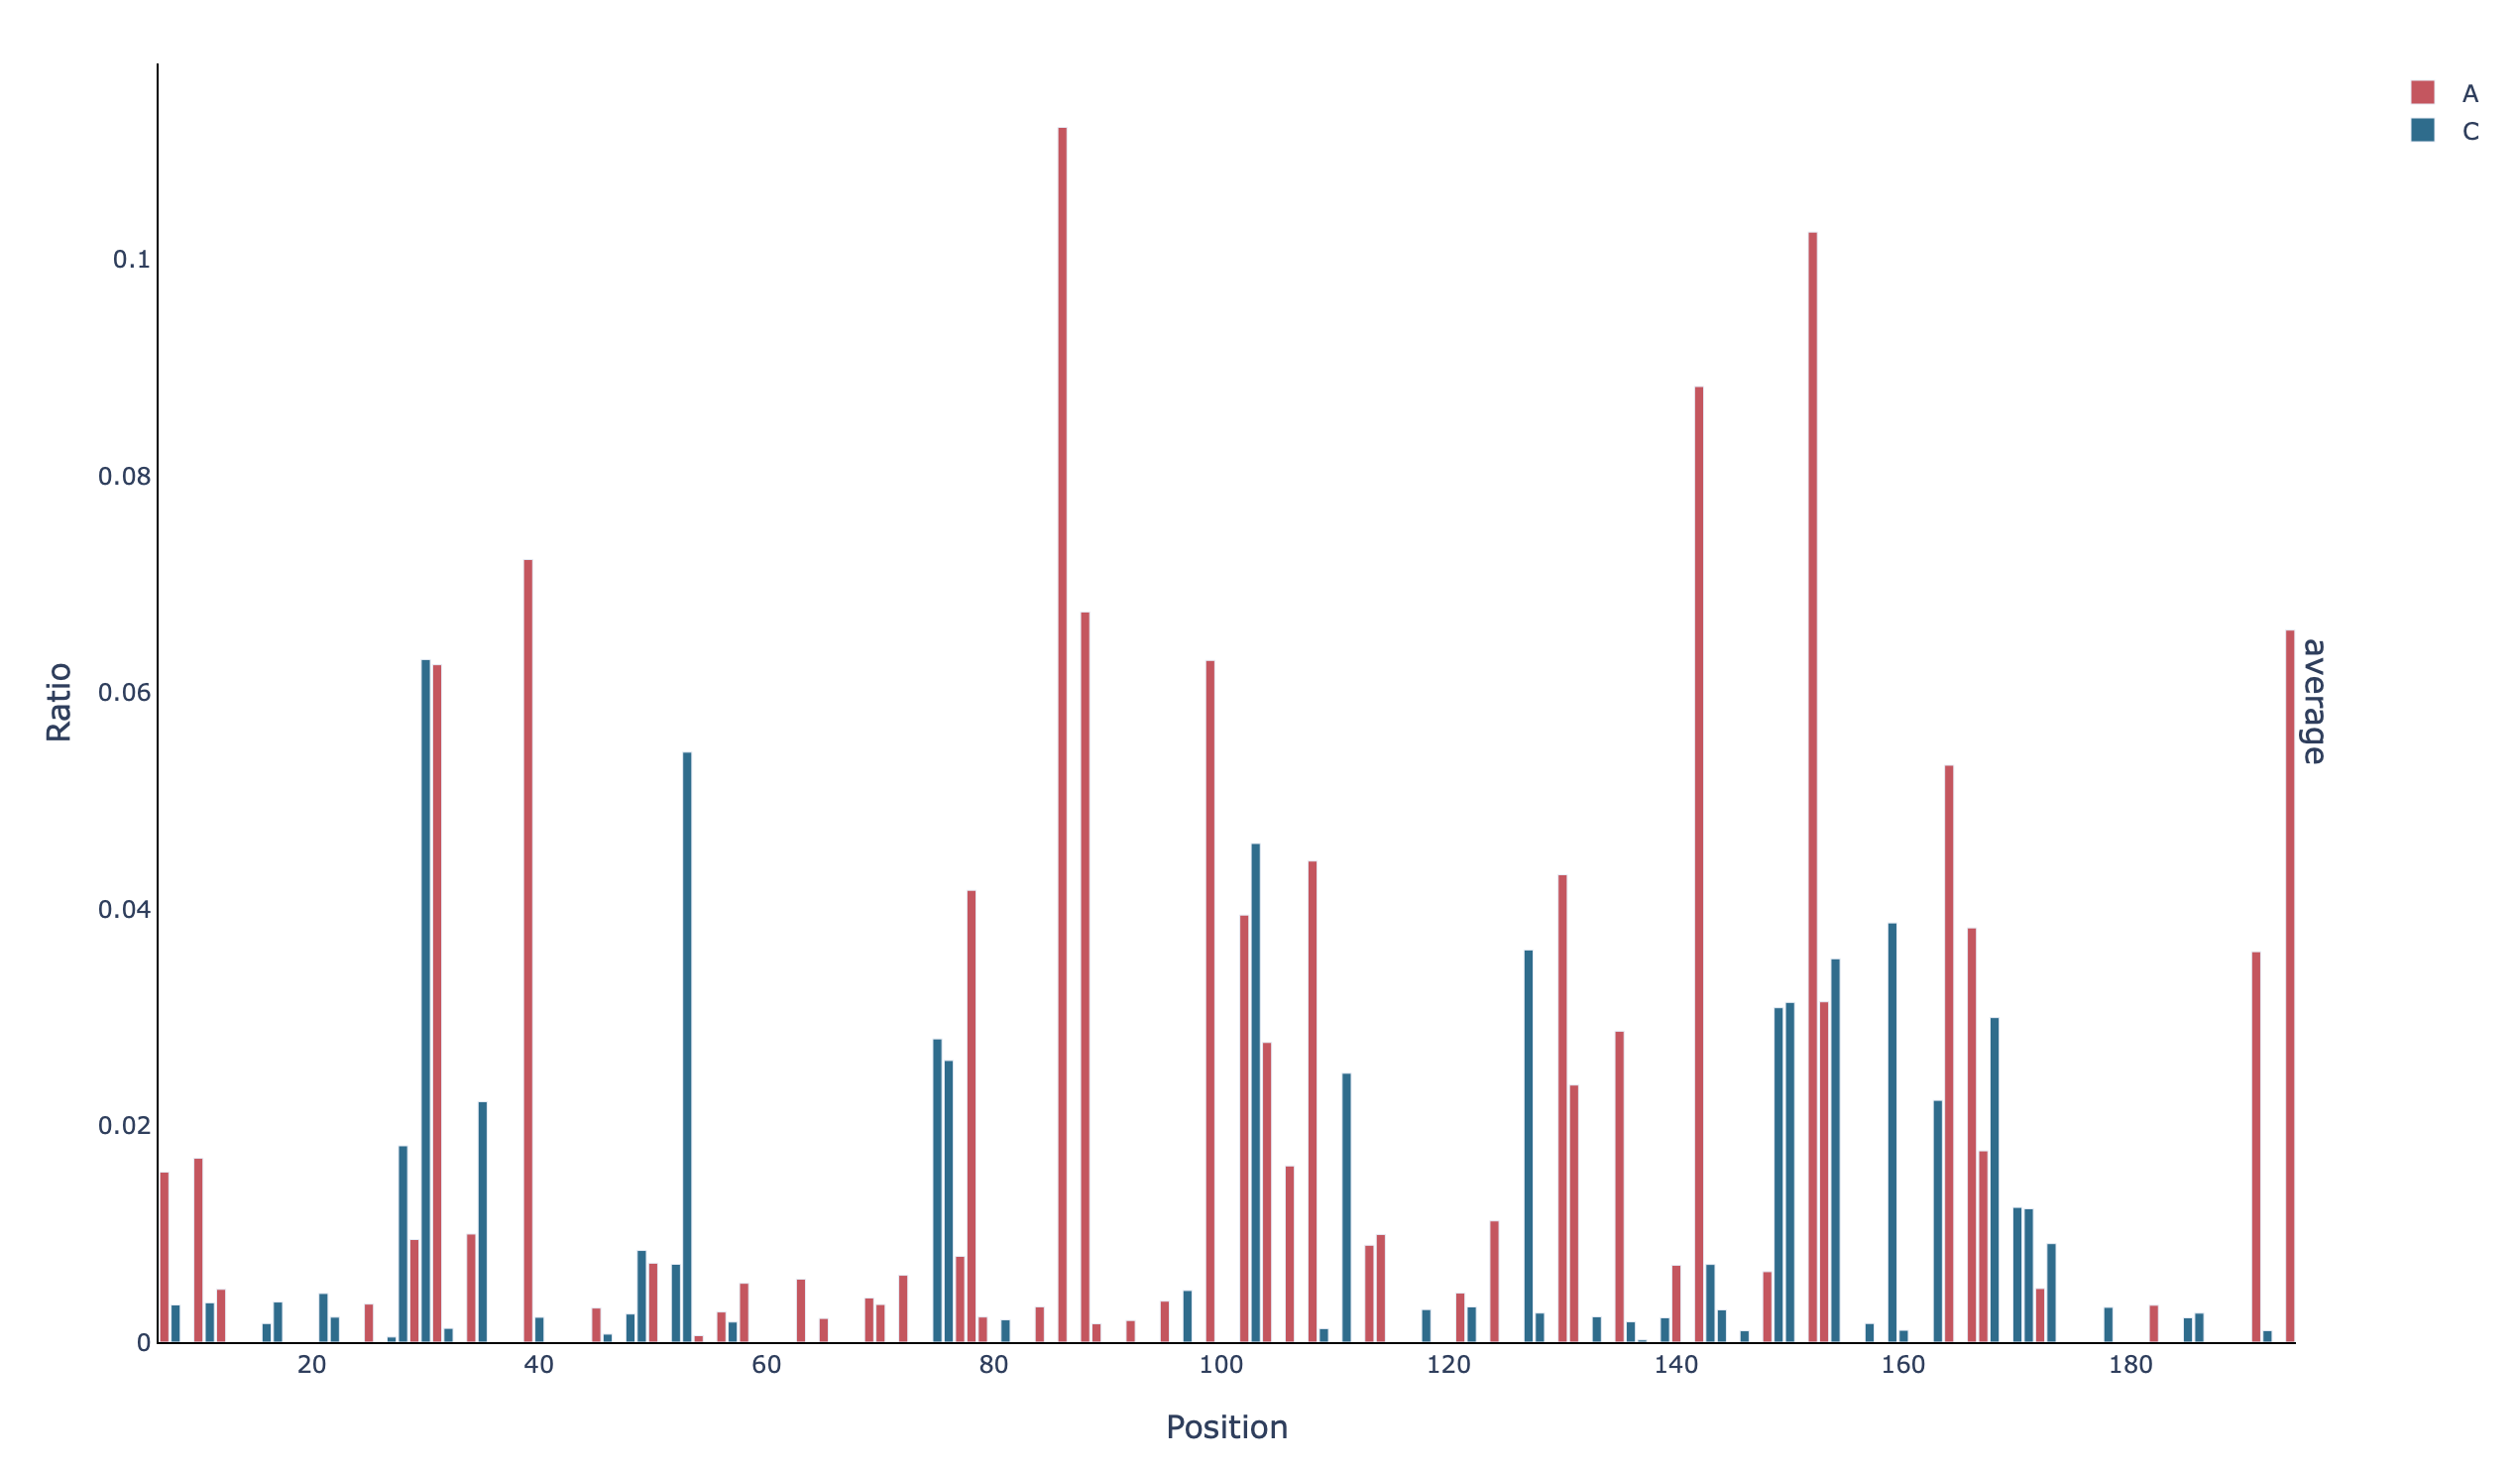
A barplot with the mutation rate per base in all positions (profile_all_m-ratio):
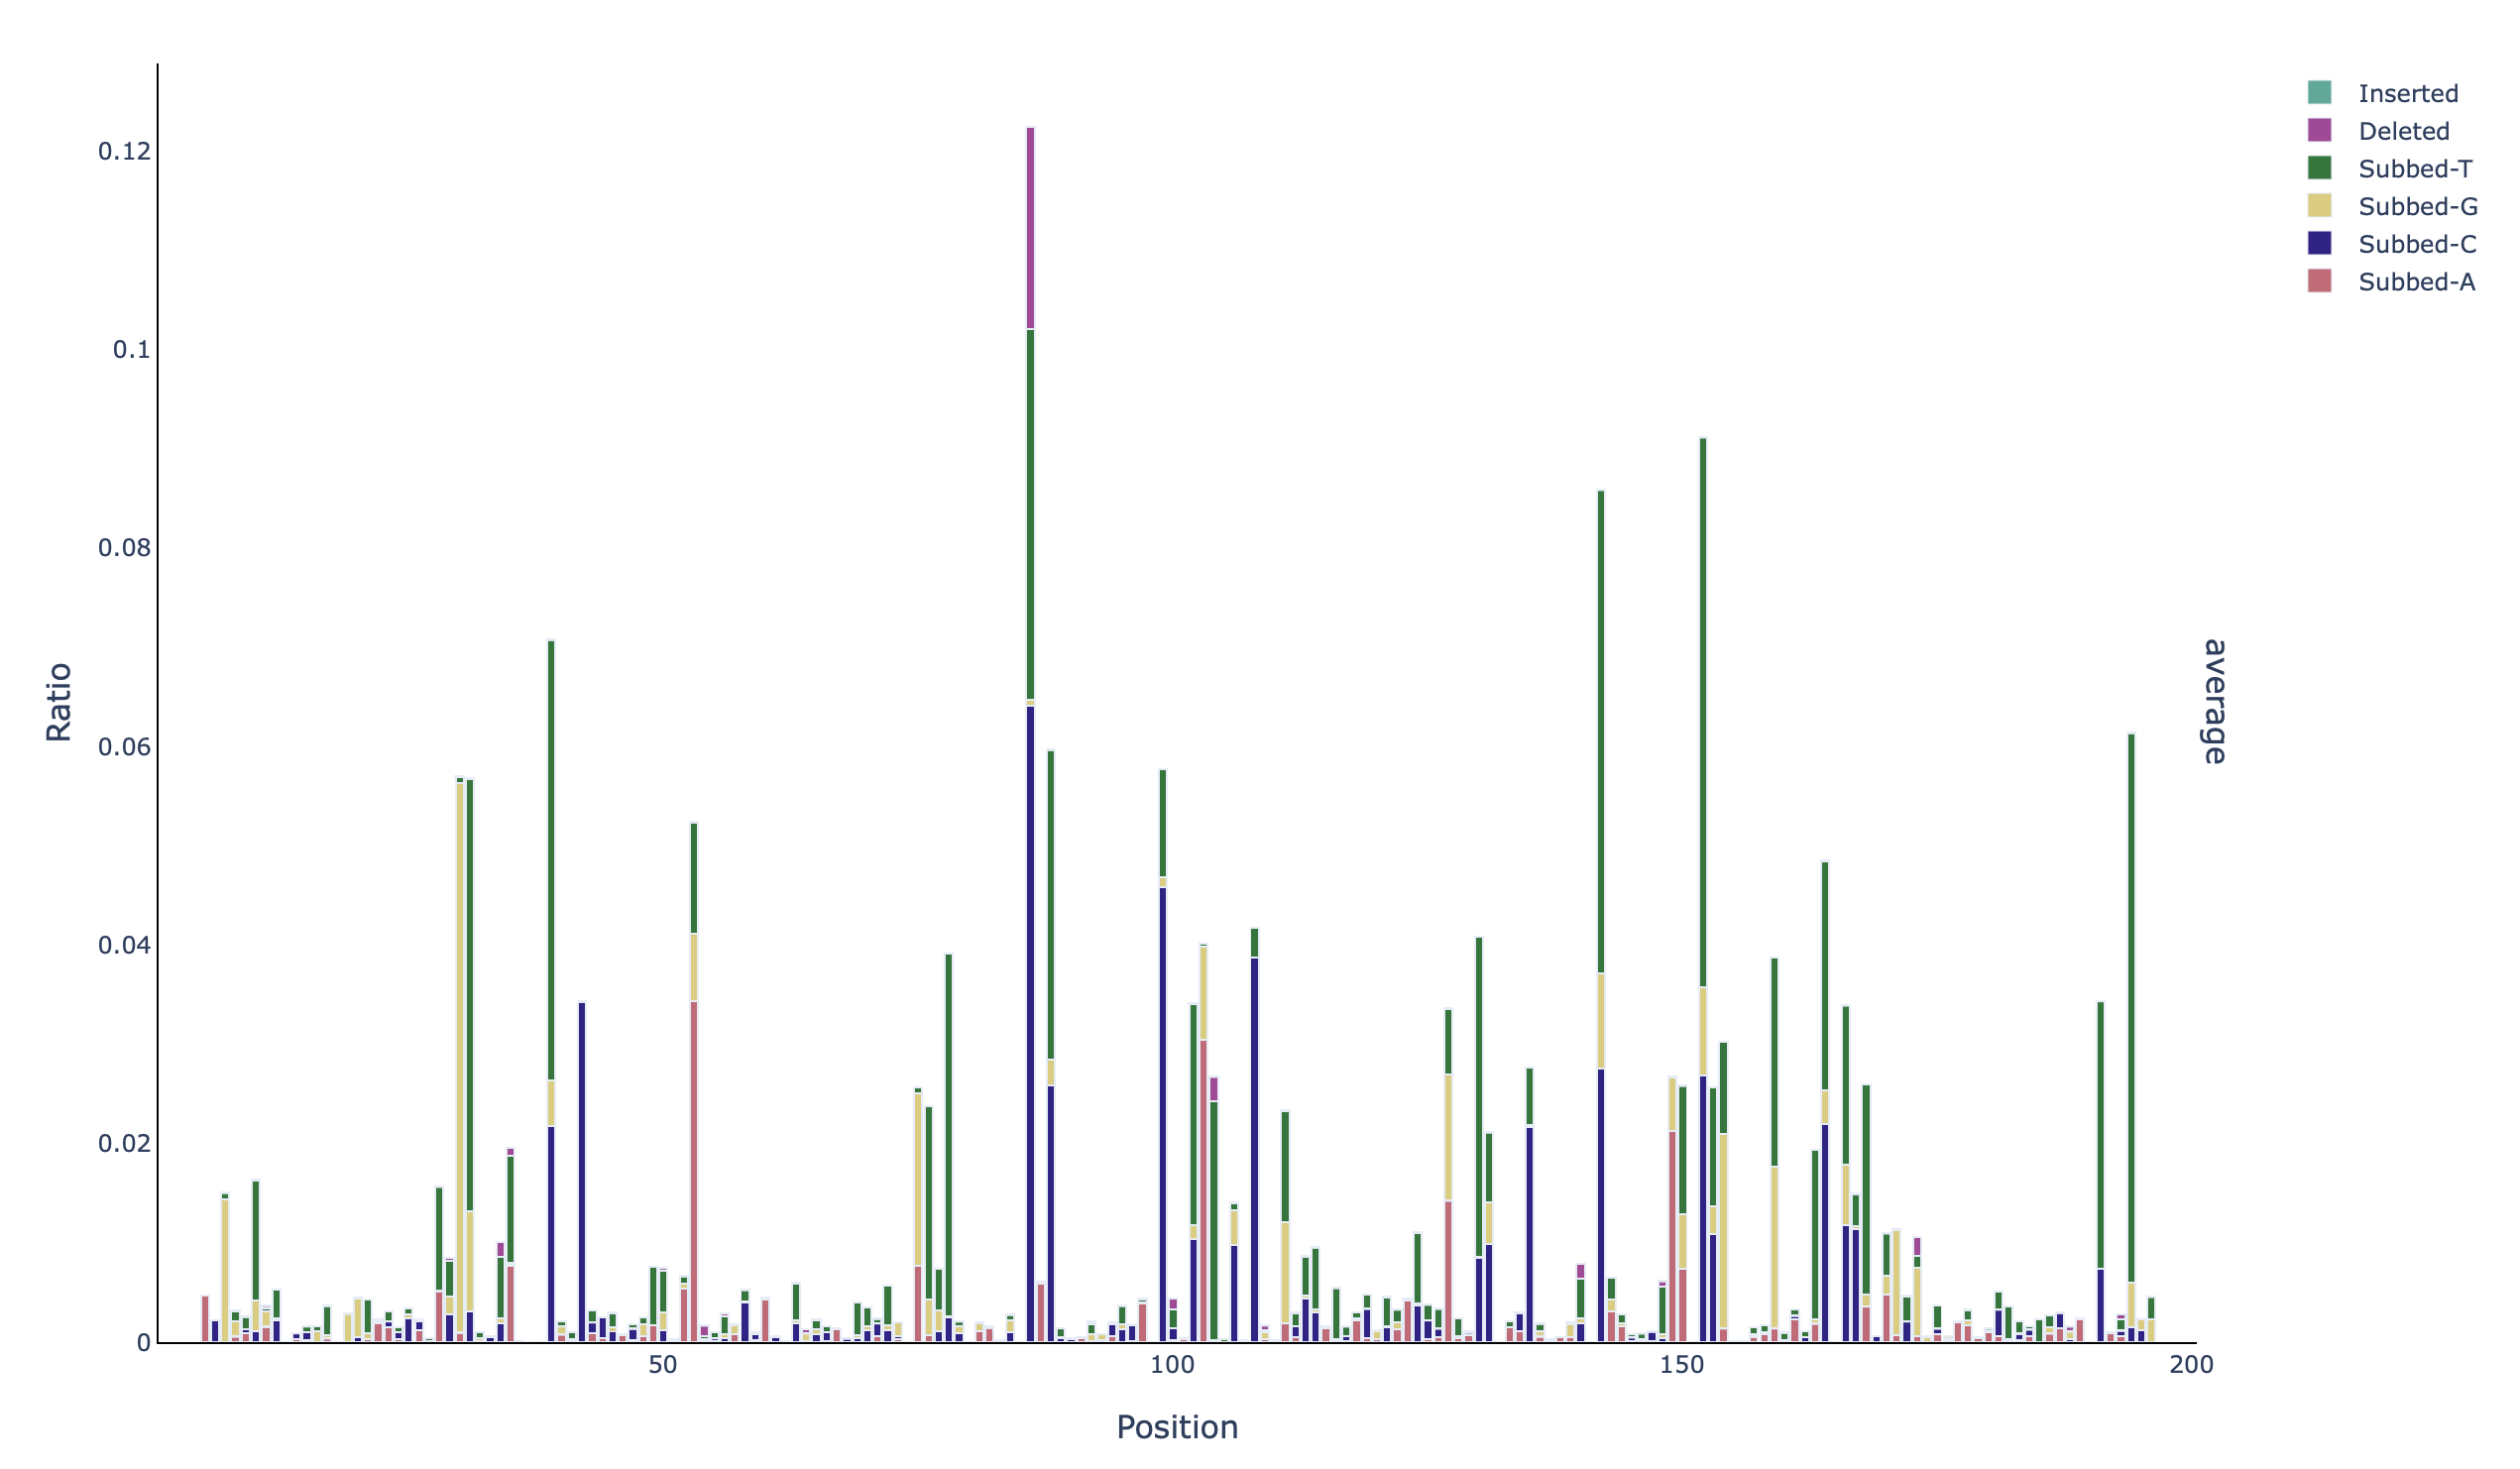
A stacked barplot with the identity of the mutations per base in all positions (profile_all_acgtdi-ratio):
A barplot with the coverage per base in the unmasked positions (profile_filtered_n-count):
A barplot with the mutation rate per base in the unmasked positions (profile_filtered_m-ratio):
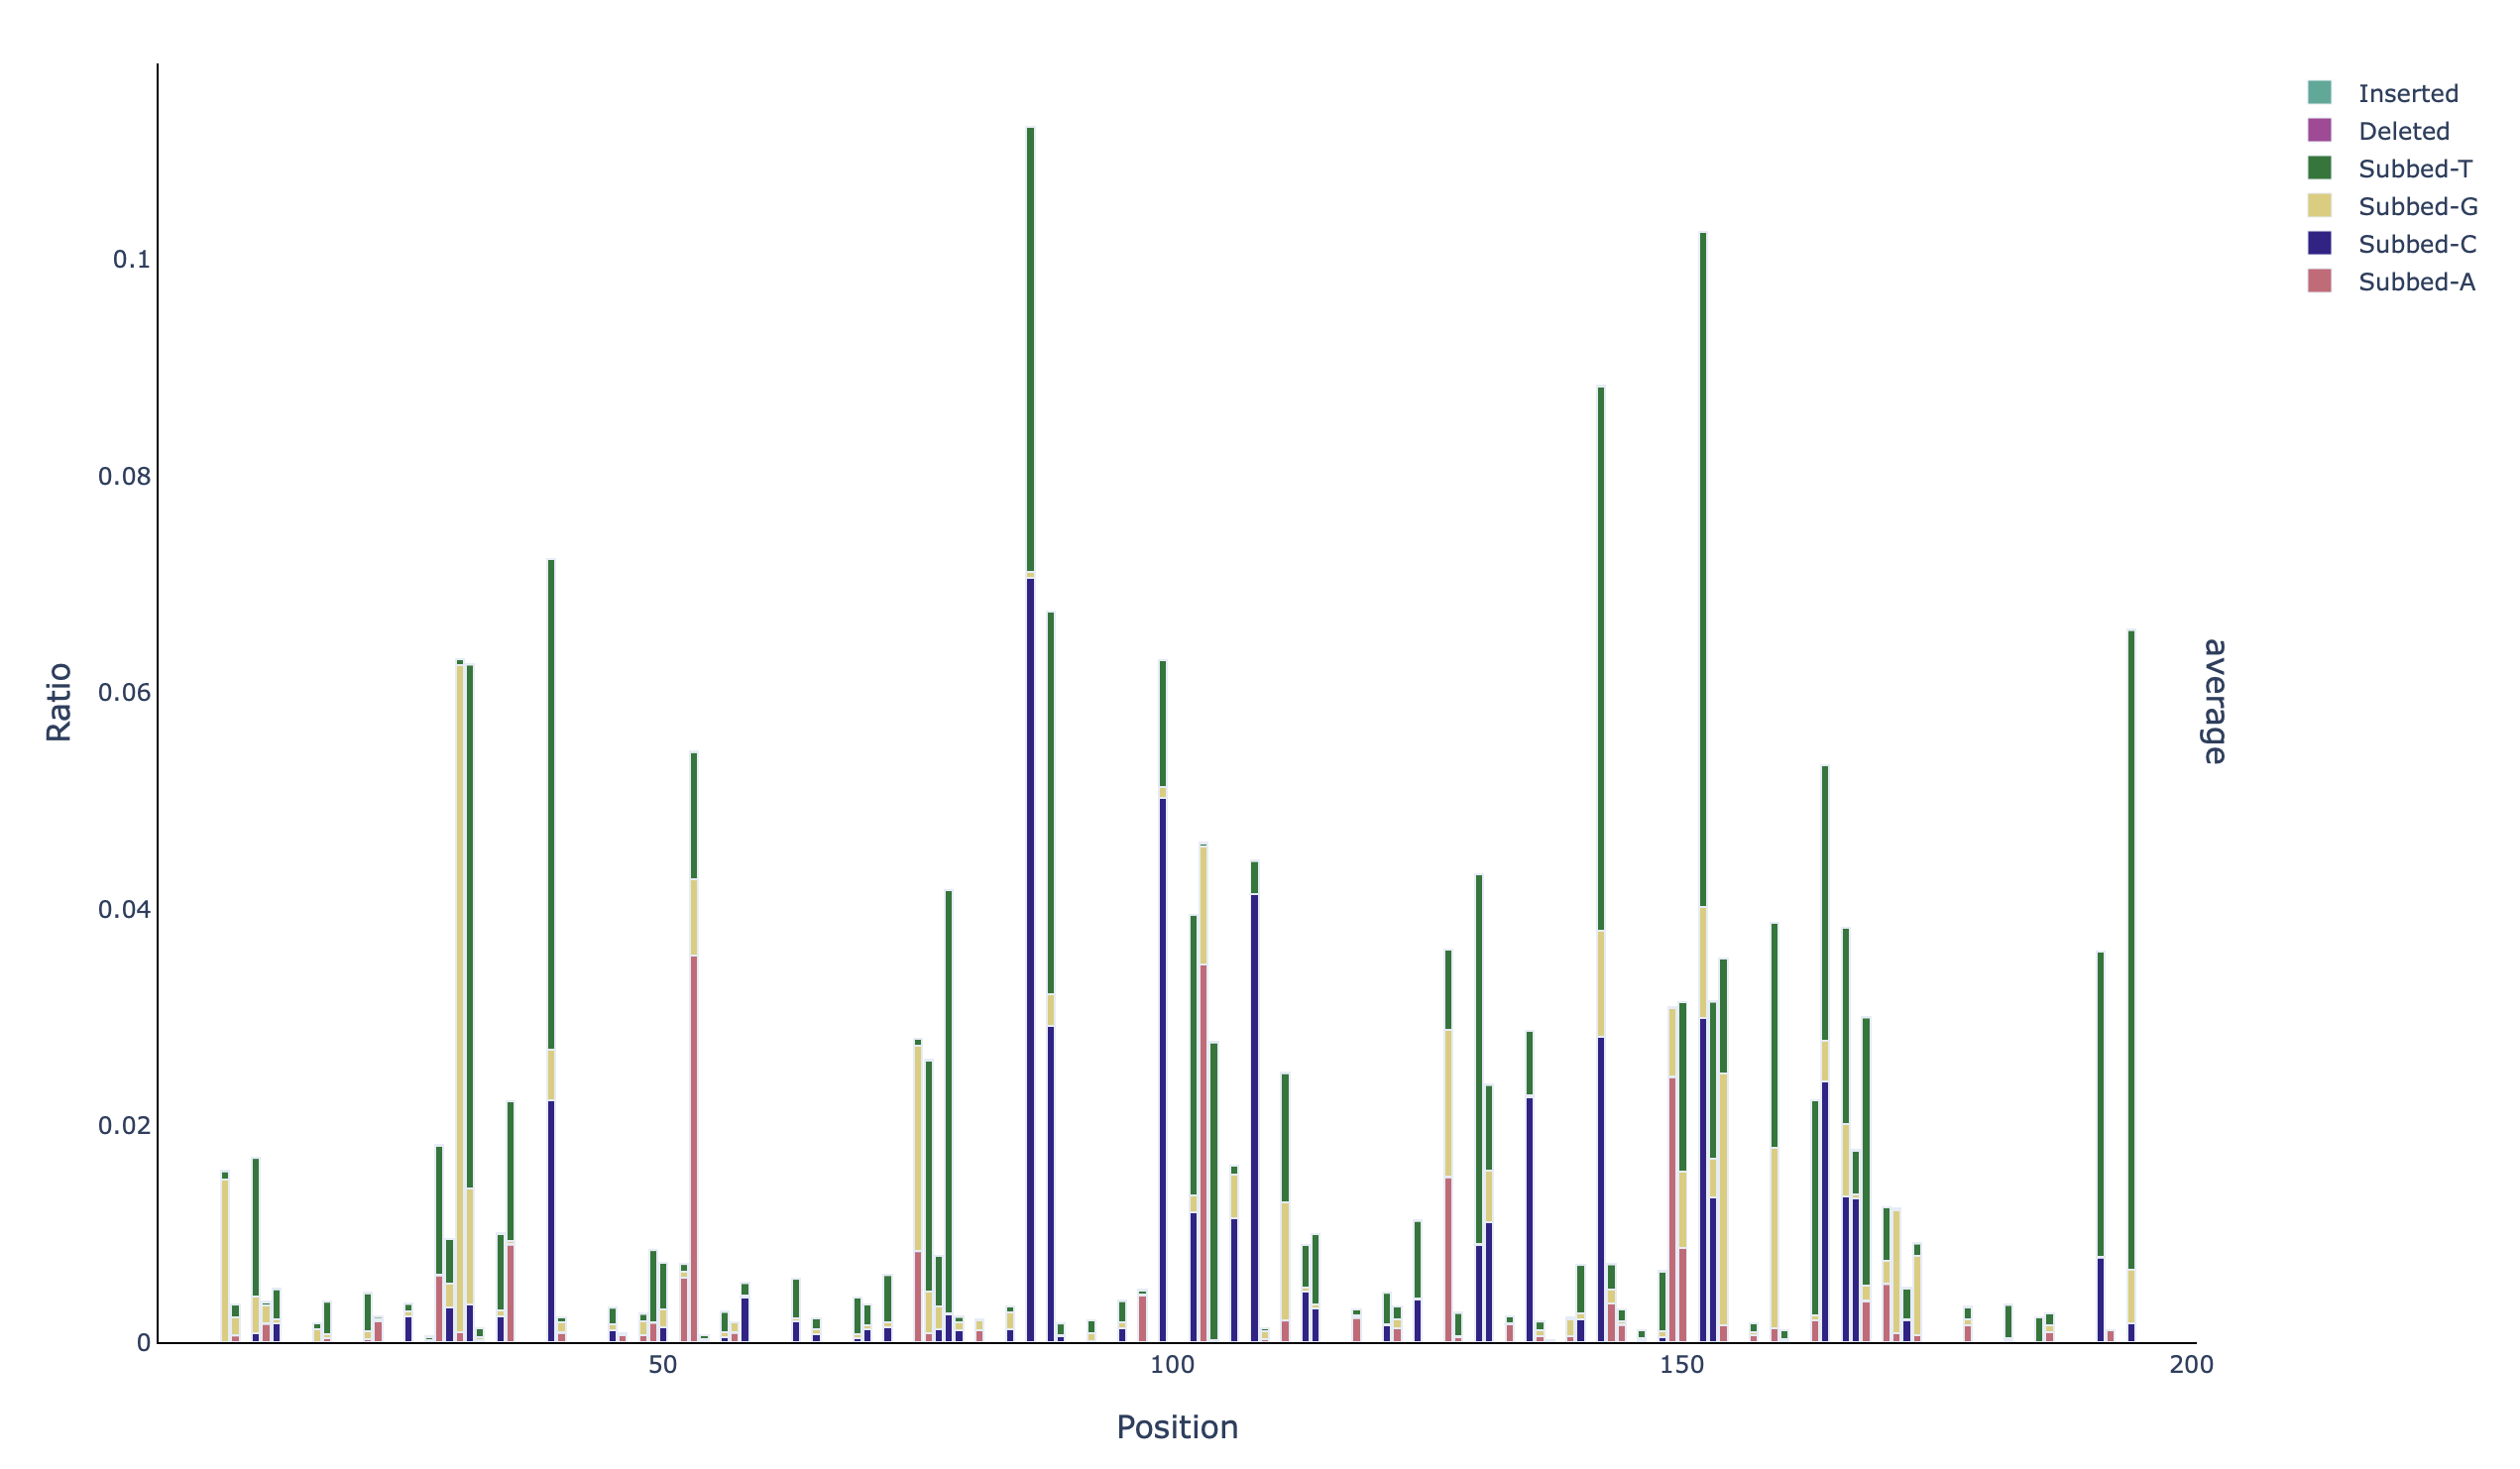
A stacked barplot with the identity of the mutations per base in the unmasked positions (profile_filtered_acgtdi-ratio):
Additionally, because the
--foldflag was included, an ROC curve plot is outputted describing the accuracy of the models provided by fold: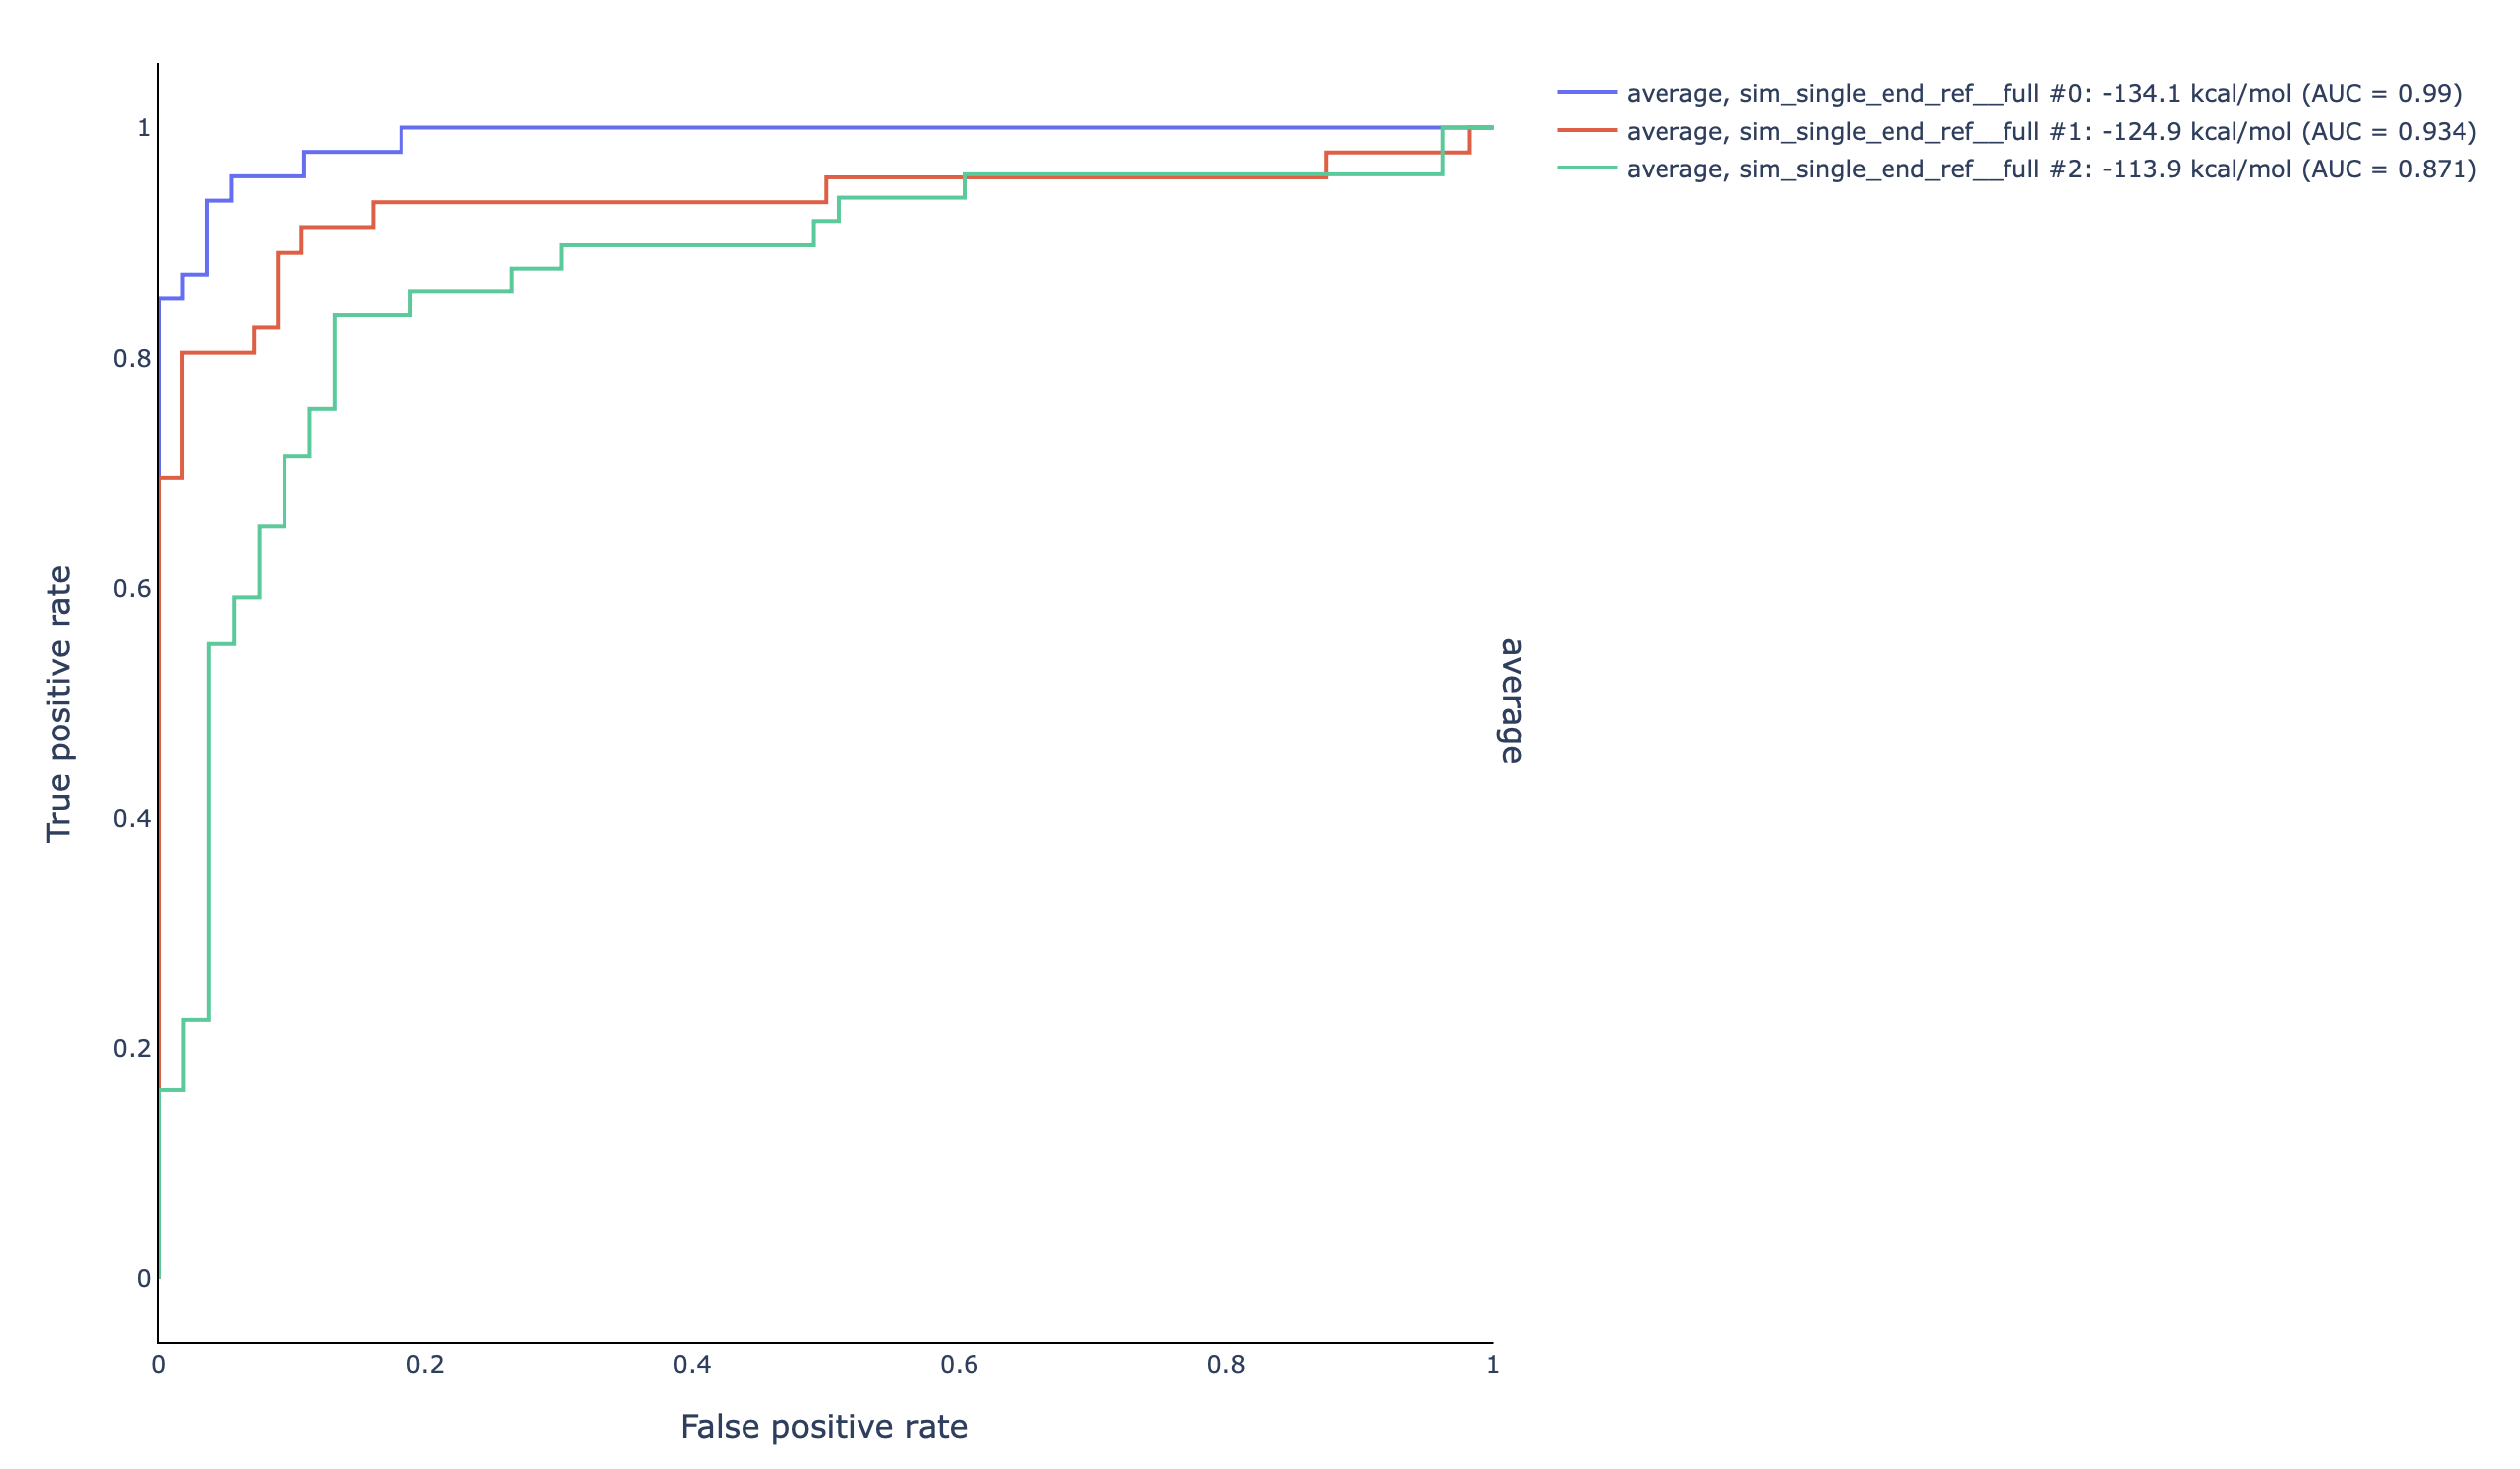
Furthermore, SEISMIC-RNA provides tables and reports
(see Report Formats) for each of the steps described above.
Since the flag --export was also chosen, a .json file is
created that can be loaded into SEISMICgraph to expand the plotting options.
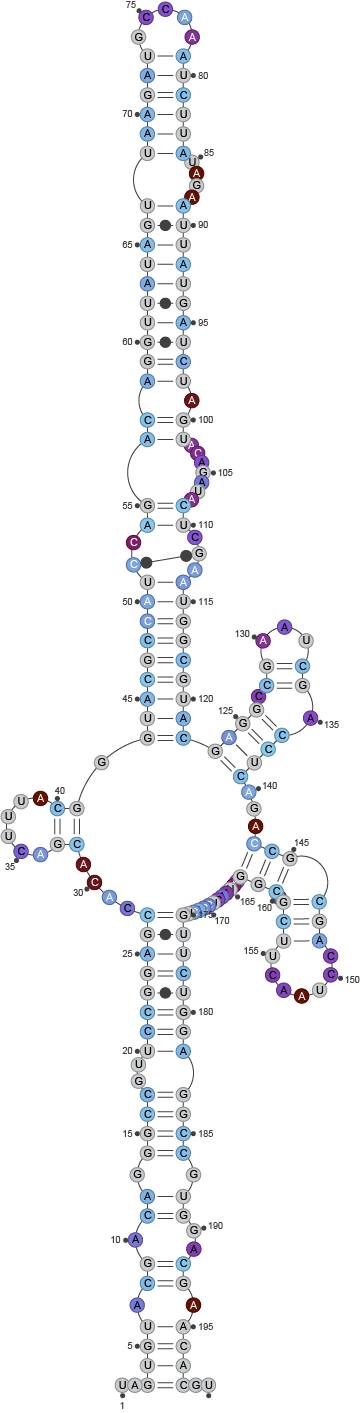
Finally, by using --draw, a model was produced too, that can
be found in the fold directory of the output: