Example 2) Clustering
In this second example, basic instructions to do clustering on paired-end FASTQs are provided.
Download example file
Paired-end FASTQ files were generated using seismic sim. The files, with
their corresponding reference fasta file, can be downloaded here: https://raw.githubusercontent.com/rouskinlab/seismic-rna/main/src/userdocs/examples/Clustering/fq/Clustering.zip
Run the SEISMIC-RNA workflow
For this example, the entire workflow (seismic wf) will be run adding a
flag for clustering (--cluster), and -x for paired-end FASTQs. There
is no need to provide the FASTQ files one by one, SEISMIC-RNA will find them
with only giving it the directory:
seismic wf fq/sim_clustering.fa -x fq/ --cluster
Output
Aside from the default outputs already described in Example 1) Running a sample with a single-end FASTQ, clustering will provide additional tables, reports, and plots:
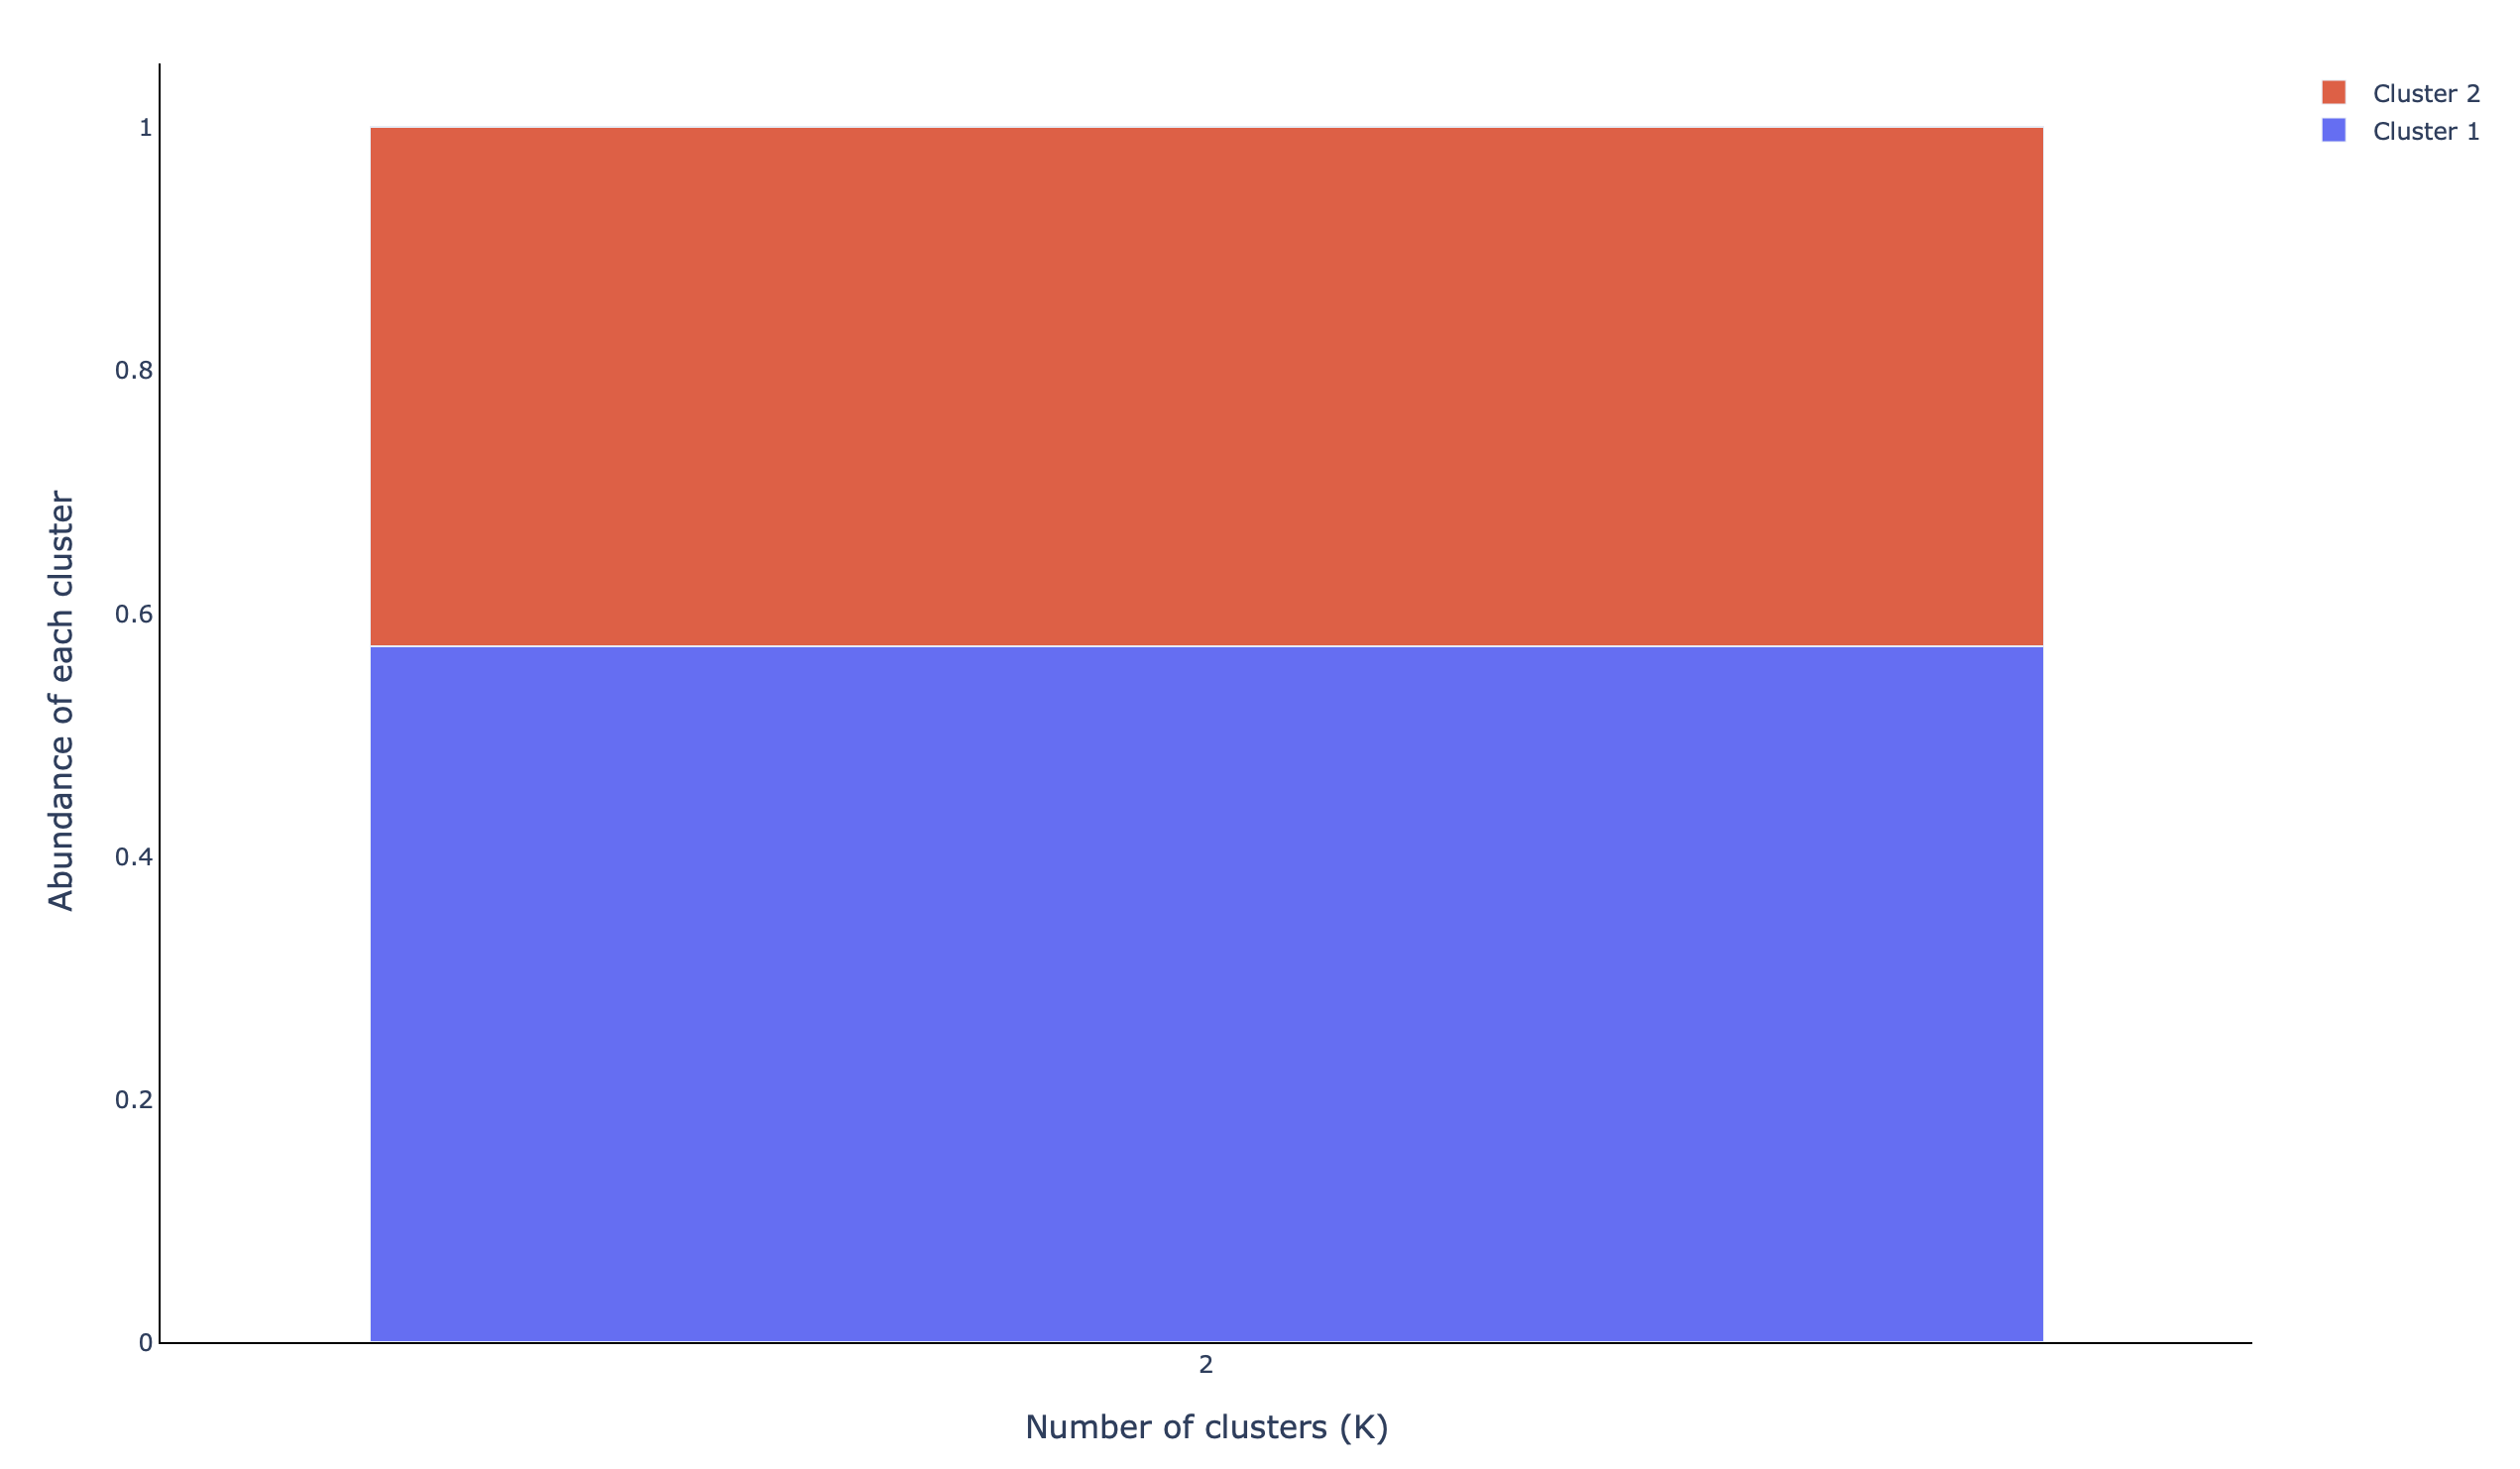
A stacked barplot depicting the abundance of each cluster found (abundance_clustered):
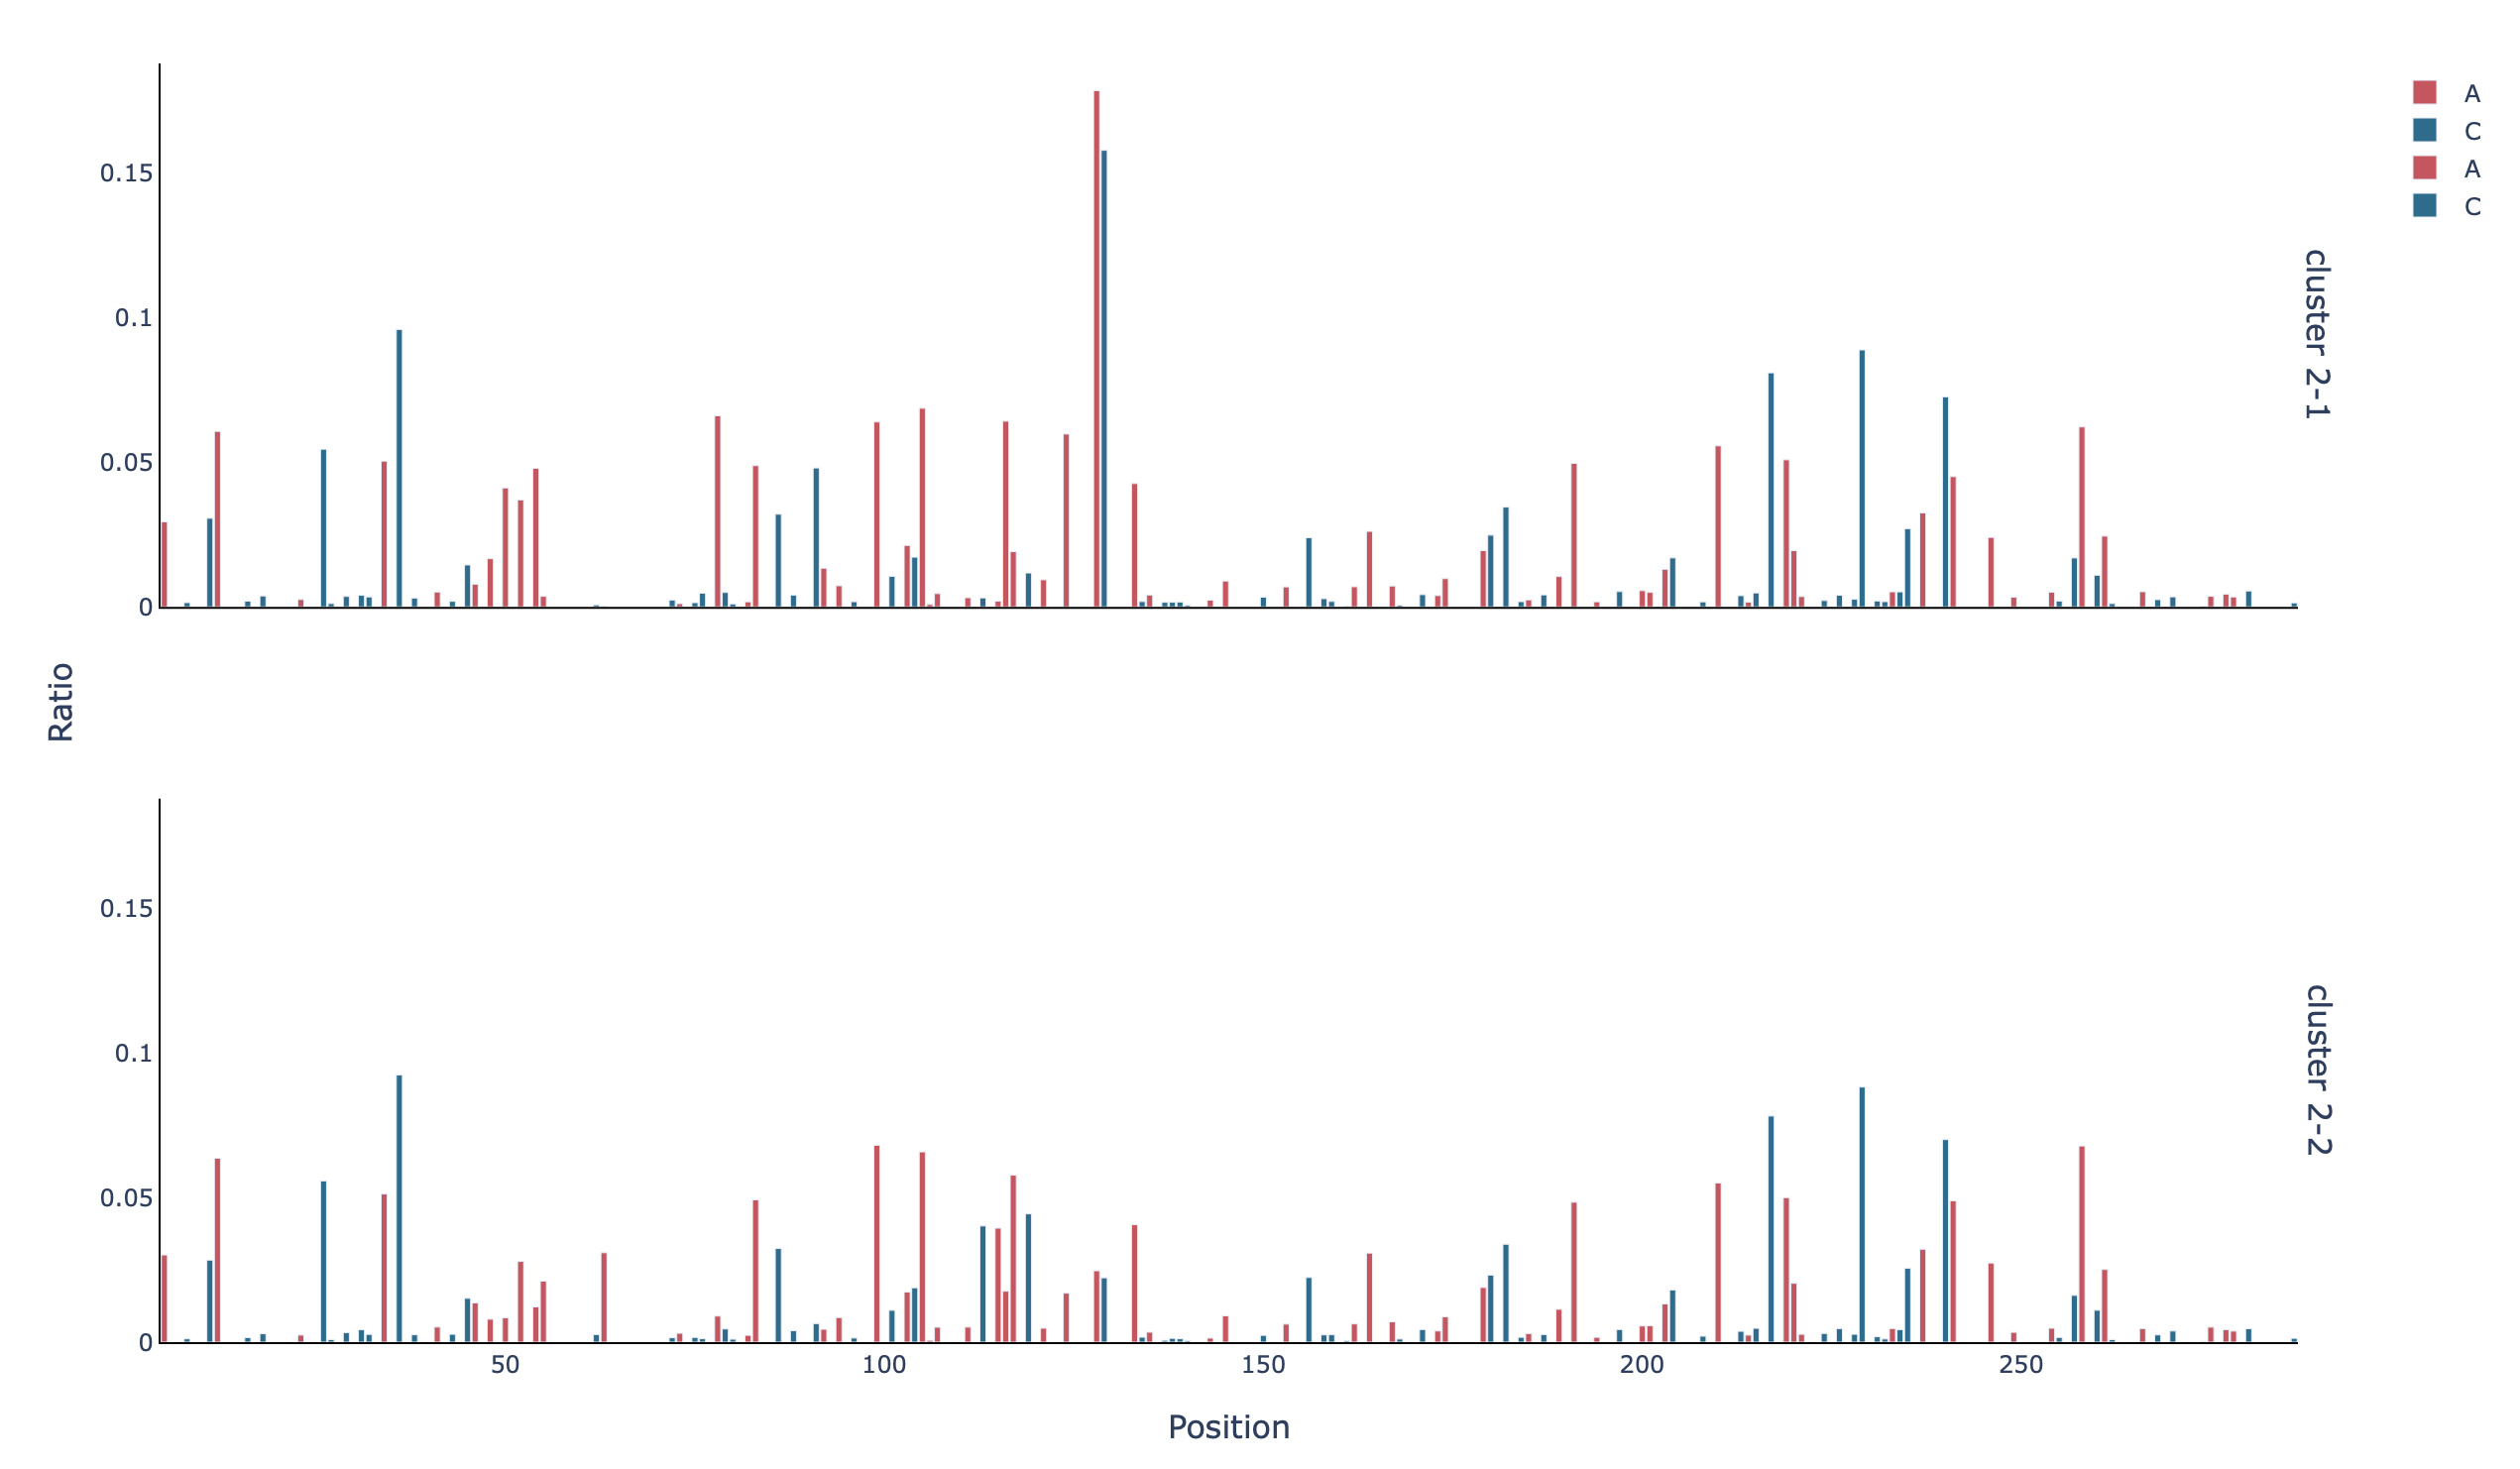
The plots that were shown in Example 1, are also provided for each cluster, i.e. the barplot with the mutation rate per base in the unmasked positions
(profile_filtered_m-ratio):
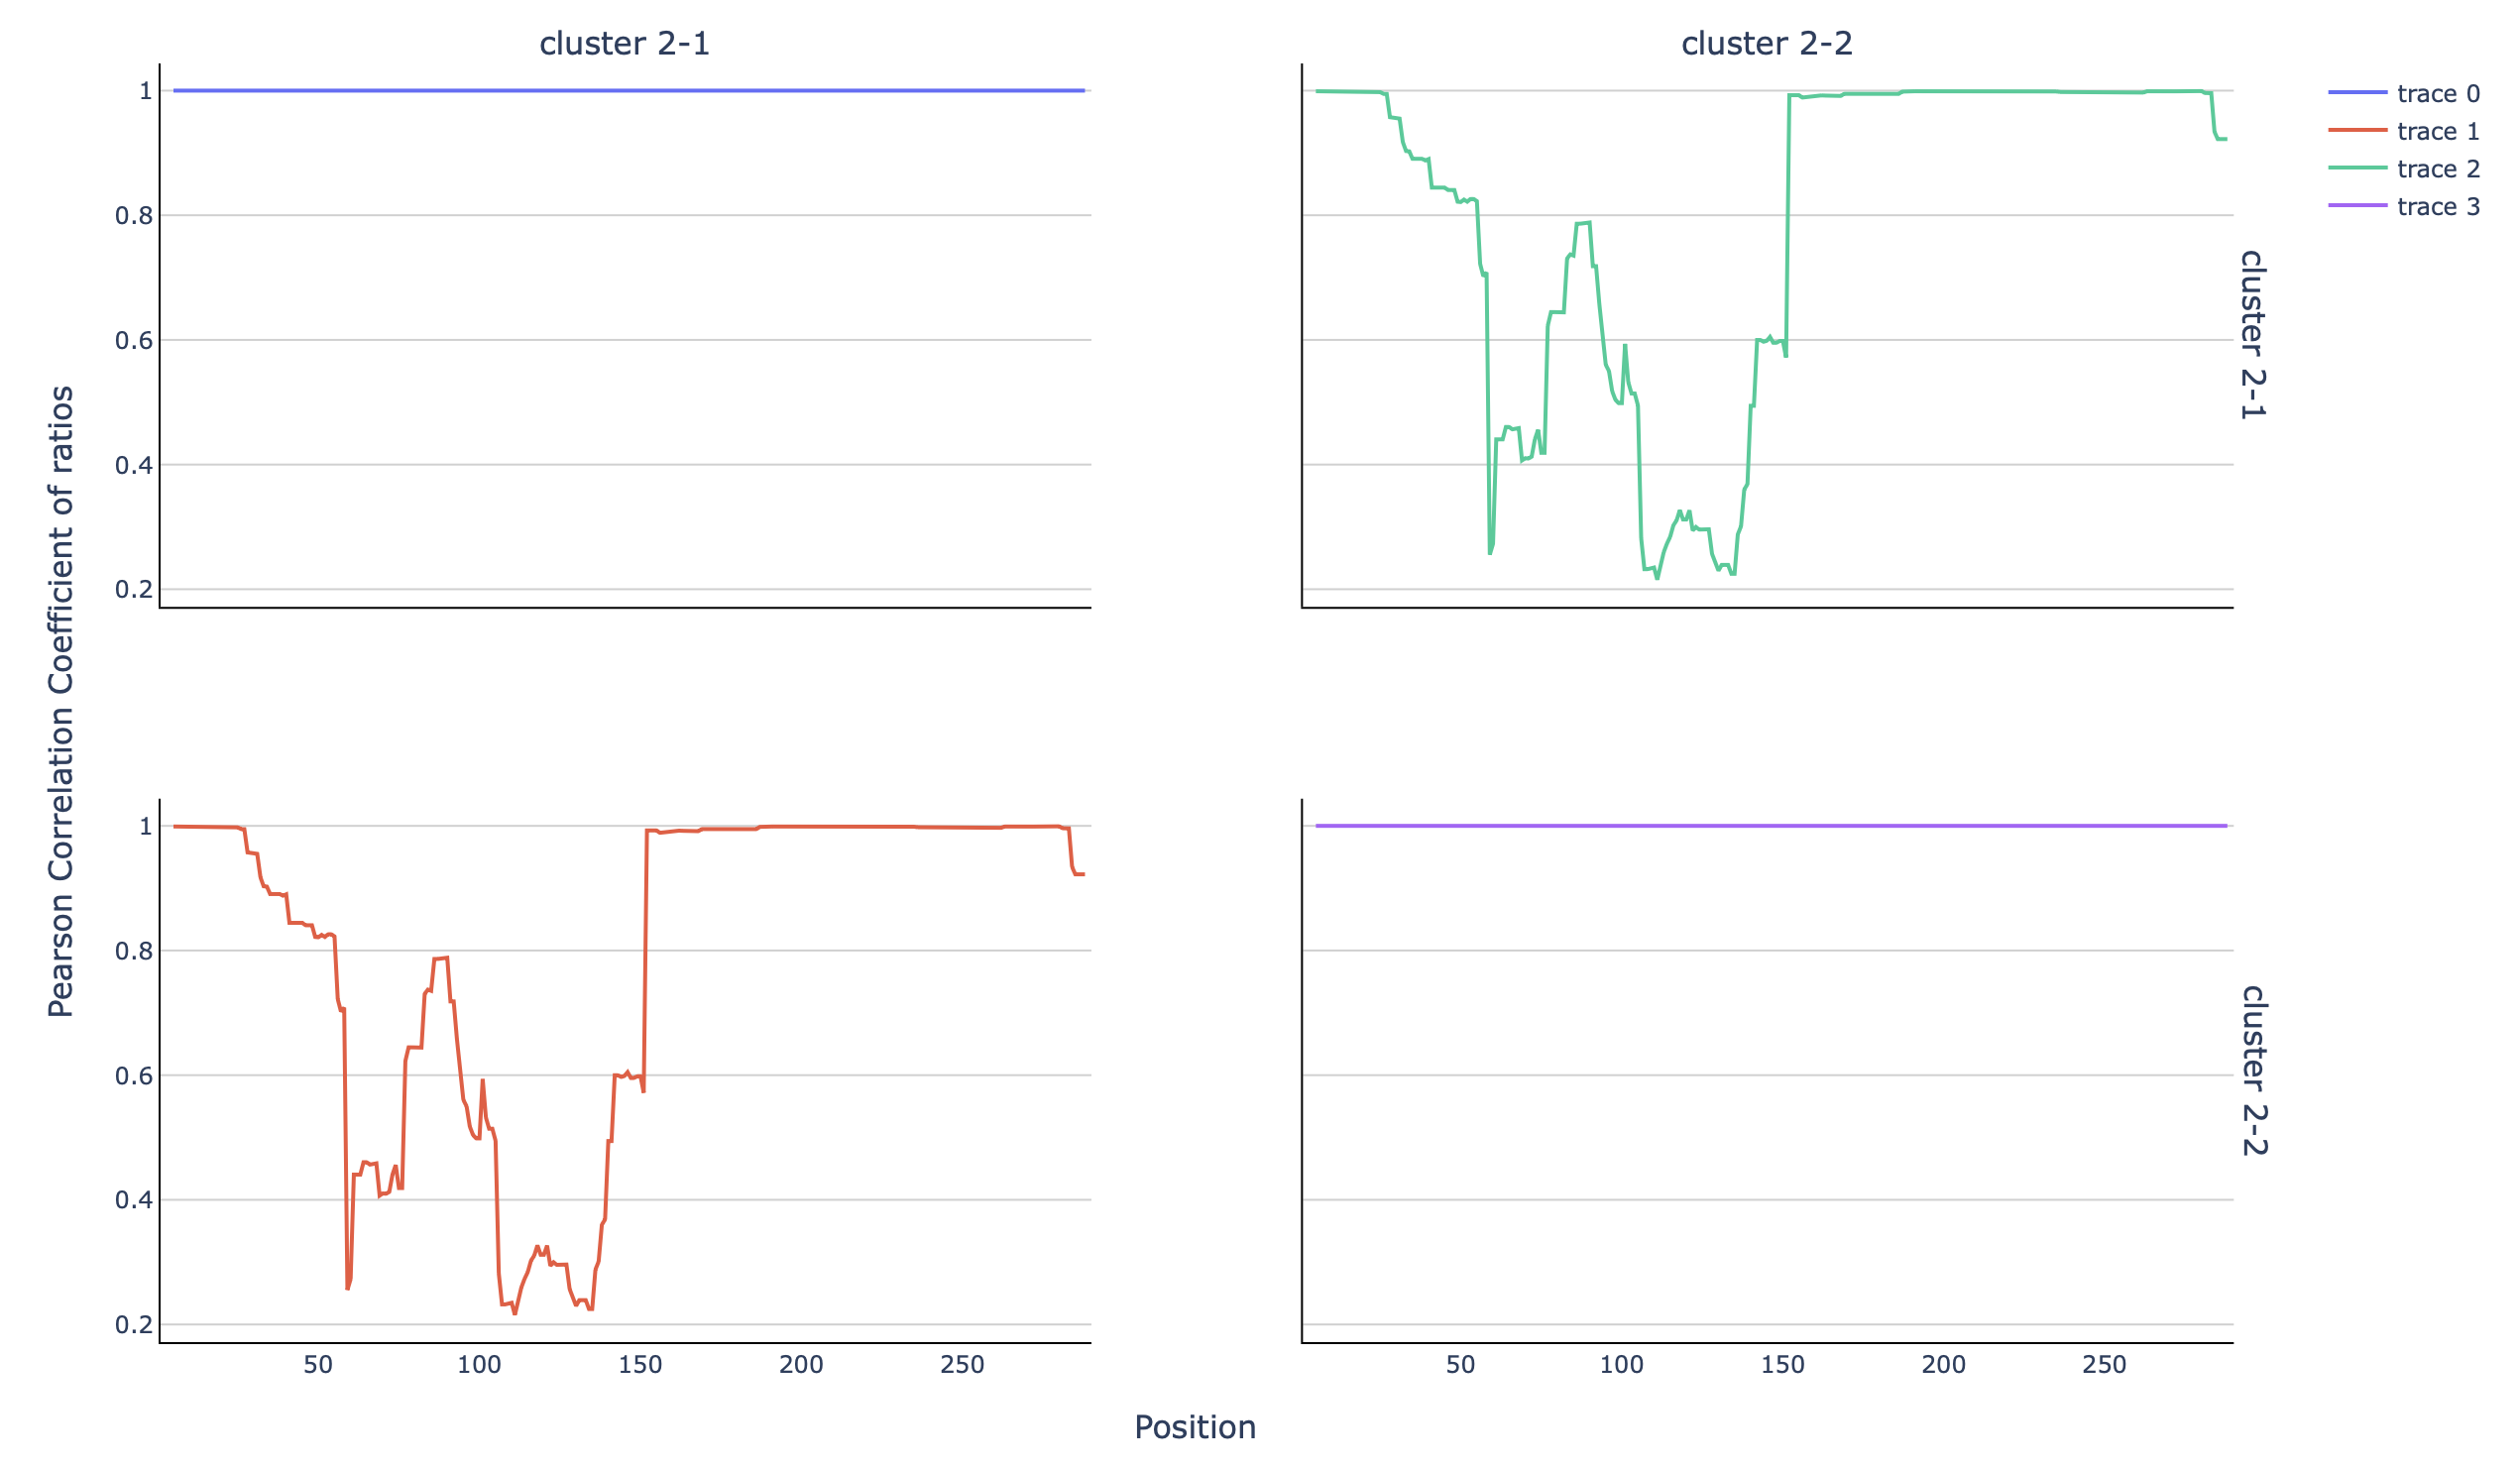
Further analysis
SEISMIC-RNA also allows for further analysis. For instance, a rolling
correlation plot can be done, comparing the clusters. For that, the seismic graph
function can be used:
seismic graph corroll /out/sim_clustering_ref/cluster/sim_clustering_ref/full/cluster-position-table.csv --compself
Where corroll indicated the type of plot (rolling correlation,
see Commands, Arguments, Options for more information), and --compself indicated that
the comparison ought to be done of the clusters in the same table (as opposed
to comparing samples in different tables).